Download
1 / 84
840 likes | 1.08k Views
Ethnicity and Degree Attainment:. Why the higher education sector can no longer ignore the attainment gap Winston Morgan PhD Principal lecturer; School of HSB. The presentation will cover:. An overview of the attainment gap The relevance of the gap

E N D
Ethnicity and Degree Attainment: Why the higher education sector can no longer ignore the attainment gap Winston Morgan PhD Principal lecturer; School of HSB
The presentation will cover: • An overview of the attainment gap • The relevance of the gap • BAME attainment nationally and at mission groups with large BAME student populations (Million+ and Russell group) • Provide some explanations for the attainment gap • Offer some strategies to narrow the gap
Sources of information (1999-2013) • Equality Challenge Unit (www.ecu.ac.uk/ ) • HESA (www.hesa.ac.uk/ ) • HEIDI (www.heidi.ac.uk) • UCAS (www.ucas.com) • UEL (MIS) • Publications by HEA, Hefce • Conferences • Interviews with BAME students at UEL
Warning!!! • This presentation contains a lot data and statements on attainment that some may find uncomfortable.
Context of the presentation • Many in academia are familiar with the general causes of the attainment gap. • Qualifications, age, socio-economic , • Few have a deeper understanding of why these factor impact on attainment and what to do. So the attainment gap remains.
Fewer in academia have an understanding of other more difficult to understand factors which also determine attainment. • Practices and policies. • The interaction between Identity, a student perception of self and the messages sent by the institution.
The prospectus says” come to our shiny university have a great experience and leave with a degree that will set you up for life” • It does not say in the small print that it will only occur if you fit a certain profile
What is the attainment gap? • For some time in the HE sector there has been significant differences in attainment (good degrees) between BAME students and their white counterparts. • the “attainment gap” • Good degree: 2:1(upper second) or first • BAME: Black, Asian and Minority Ethnic
Relevance? • Over 20% of students in HE are BAME (some institutions >50%) • A high proportion of international students are BAME (growth areas) • Interaction with our stakeholders • League tables
Half the criteria for University League Tables are directly impacted on by BAME student attainment.
Fees • Legal obligation ?
The attainment gap in practice • A black student with “AAA” at A level studying at Russell group university has less chance of gaining a good degree than a white student with “CCD” studying at a post-92 university.
For post-92 and Russell group institutions with a large or majority BAME student population, narrowing the attainment gap should be a priority. • The “success” of such institution is directly dependent on the performance of BAME students. • Worryingly the gap has not significantly changed since 2003.
Clear evidence of an attainment gap. • Two initial questions • Is the gap unique to UEL? • What determines the attainment gap?
A more detailed examination of BAME attainment: • Nationally • At mission groups with large BAME student populations (Million+ and Russell group)
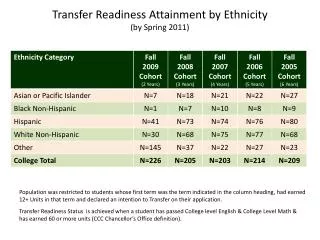
The picture nationally • Nationally BAME students make up 17-22% of the HE population, mainly concentrated in post-92 institutions and inner city Russell group universities. • BAME make up about 9% (12-14%) of the population (pre 2011 census)
Ethnicity profiles of UK-domiciled first degree leavers by academic year (Equality challenge unit 2011)
Factors which determine the gap • Over the last 20 years, many studies undertaken • Most come to the same conclusions
Key studies The 2007 DfES study (Broecke and Nichols, 2007) Connor et al. 2004, Leslie 2005, Richardson 2008, Richardson 2009. Hefce 2010 http://www.ecu.ac.uk/publications/files/improving- degree-attainment-bme.doc
Entrants profile which may explain the gap • Poor attainment is linked to an intersection of key factors • qualifications on entry, • age • socio-economic background, • subject, • institution • ethnicity
Ethnicity and Degree AttainmentStijn Broecke and Tom Nicholls 2007
HEFCE study 2010 • Profile and progression of entrants to full-time, first degree study • Modelling to account for student profile
Implication from previous studies? • There must be more difficult to quantify factors also impacting on the attainment of BAME students.
Both my data and previous studies implicate two factors as having the greatest impact: • Qualifications on entry • Student age profile
A closer look at age and qualifications: • At contrasting mission groups • Ethnicity
Qualifications on entry • What we know • Entry qualifications are the most accurate predictors of performance at university, • Most universities do not add relative value to their students (Cambridge, 2012).
Institutions at the top of the university league tables have the highest entry points. • The attainment gap is narrowest for students with the best A-levels such as those at the Russell Group?.
Most post-92 institutions have a widening participation history • Significance? • the qualification profile of post-92 institutions is very diverse • this has a big impact on the student experience and attainment.
What is the key qualification • A-levels remain the best preparation and predictor for degree success ( HEFCE 2010, Cambridge 2012,). • Nationally fewer Black (young) students (81%) enter with A-levels compared to white and Asian (90%) students.
Asian students even in post-92 institutions are still the most likely to have A-levels. • Mature students are the least likely to have A-levels • At Million+ institutions white students are performing at the national level for good degrees although they enter with average tariff points over 100 less than the 320 national average. • These institutions are capable of adding value but only to white students
The impact of age on attainment • Attainment is complicated by age and ethnicity • Age negatively correlates with attainment in HE for BAME. • Million+ institutions have a high proportion of mature BAME students.
At million+ and post-92 universities mature white students perform better than all groups. • This has a big impact on the gap at UEL.
The impact of age on student performance at Million+ and Russell group
Some possible explanation for the impact of age • Successful mature students have at least one of the following characteristics;
Previous experience and success at university, • Previous professional or management experience, • Traditional university entry qualifications • Confidence and secure in the university environment.
Unsuccessful mature students: • Previously struggled at school. • Have unresolved issues relating to learning and teaching and possibly behaviour. • Have A-level equivalents (Access) . • Not confident and secure in the university environment.
Impact of University Policies and Practices • A disproportionate number of BAME (Black, International) students are involved in assessment offences