Download

1 / 22
220 likes | 225 Views
SCIENCE LAB REPORT FORMAT. PARTS OF A LAB REPORT:. 1. TITLE PAGE 2. INTRODUCTION ( PROBLEM DEFINITION) 3. EXPERIMENTAL DESIGN 4. PROCEDURES 5. ANALYSIS OF RESULTS 6. CONCLUSION 7. LITERATURE CITED. TITLE PAGE. ON A SEPARATE SHEET OF PAPER: Name of experiment or exercise Your name

E N D
SCIENCE LAB REPORT FORMAT
PARTS OF A LAB REPORT: 1. TITLE PAGE 2. INTRODUCTION(PROBLEM DEFINITION) 3. EXPERIMENTAL DESIGN 4. PROCEDURES 5. ANALYSIS OF RESULTS 6. CONCLUSION 7. LITERATURE CITED
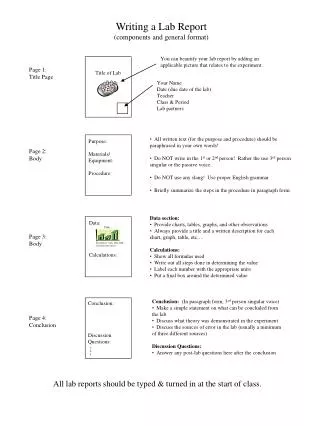
TITLE PAGE ON A SEPARATE SHEET OF PAPER: Name of experiment or exercise • Your name • Name of lab partners • Name of class • Date experiment done • Date report submitted
Color variation in M&M's By: Heather Fogell Lab Group #1: Olive Science, Itza Greatclass AP Biology Experiment Date: February 1, 2004 Write-up Date : March 3, 2004
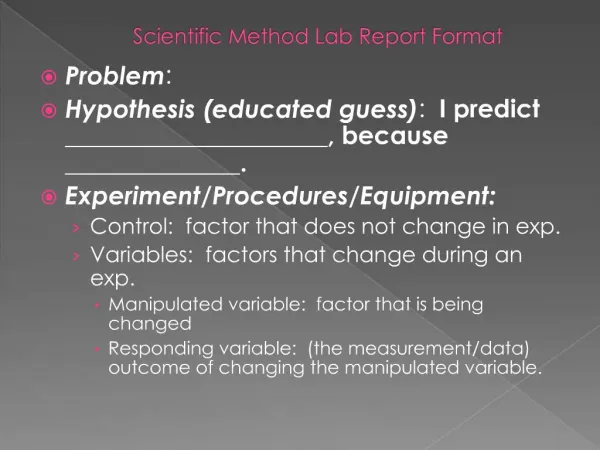
INTRODUCTION The Introduction… • supplies background information needed to understand the problem. • may provide a theoretical basis and historical context for the work done in the lab. • Specifies the problem and hypothesis. To write the introduction… • Give background information on your topic and more specific information on the exact areas that you are studying • Cite information that has been published in research articles or books related to your study. • Clearly SPECIFY THE PROBLEM being investigated or the objective of the study. • Toward the end of this section you should EXPLICITLY STATE YOUR HYPOTHESES!!
INTRODUCTION M&M’s are a popular snack food made by M&M Mar’s Company. First developed in 1941 and famous for “Melting in your mouth and not in your hands” each candy consists of chocolate covered with a hard colored coating (1). In the 1980’s variations were added that contained peanuts, pretzels, coconut, and coating colors were added that mirrored traditional holiday colors (2). This study explores the allocation of coating colors within the king-size packages of peanut M&M’s. Specifically, are the same amount of each color candy in each package?. It is hypothesized that color assortment is random and the same amount of each color is not present in each king-size package.
EXPERIMENTAL DESIGN (METHOD) Is the laying out of a detailed experimental plan in advance of doing the experiment • description • illustration • labels • reasoning For most labs, the methods will come from a lab manual handout. (The degree to which your manual/handout may be used for citing methodology is up to your instructor.) Well chosen experimental designs maximize the amount of information that can be obtained for a given amount of experimental effort
PROCEDURES • Describe the procedures that enabled you to collect your data • DO NOT simply list the "materials" • Include details that would permit someone to repeat your work based on their reading of this section • AVOID insignificant details such as the name of the company that made your pipette or the day of the week on which your lab occurred. • A good procedure is so detailed and complete that it lets someone else duplicate your experiment exactly • The predominant verb tense in this section is past tense.
ANALYSIS OF RESULTS PRESENT FINDINGS: • usually in the form of numerical data • Provide data that have been condensed to some degree rather than raw data. • If you are presenting calculated means, include some measure of data variability (e.g. standard deviations). USE TABLES OR FIGURES: • DO NOT simply refer readers to tables and figures!! Results must be verbally expressed in this section. • Draw the reader's attention to particularly noteworthy data or the presence of meaningful trends • If possible, support this with statistical analyses, keeping in mind that statistical significance may conflict with your sense of biological significance. HELPFUL TIP: The text of this section should summarize the data, but stop short of interpreting their meaning or drawing major conclusions about their importance.
Results As seen in table #1, none of the bags have the same amount of each color. Figure #1 shows brown is the most frequent in bag one and orange is the least. Figure #2 shows blue is the most frequent in bag two and green is the least. Figure #3 shows red is the most frequent in bag three and yellow is the least.
TABLES*May be used to organize large groups of numbers 1) Include a table heading at the top, summarizing the table’s contents. It is usually a SINGLE sentence fragment and may lack a verb. 2) Use superscripts and footnotes to provide additional information about the contents of the table. 3) Each table should be on its own piece of paper or neatly integrated into the end of the results section.
FIGURES (GRAPHS/PHOTOS)*Can be particularly useful to display trends in data. FIGURE LEGENDS 1) Every figure requires a separate figure legend at the bottom. 2) Figure legends should provide just enough information to allow the reader to interpret the figure. Unlike table headings, figure legends may consist of several sentences. The first sentence is often a sentence fragment (a conceptual title). FIGURES 1) Each figure should be centered on its own separate piece of paper or neatly integrated into the end of the results section. 2) All axes should be labeled. The letters and numbers on the X (horizontal) and Y (vertical) axes should be large enough to clearly read. 3) Include a key inside complex figures to identify symbols, lines, or bars.
CONCLUSION Interpret your data and evaluate the meaning of your results. The Conclusion includes the following… • Briefly summarize trends or important results • Was your hypothesis, as stated in the Introduction, supported by the data? • Do your results contradict, reaffirm, or extend previously published findings? • Answer the problem. When writing this section… • Don't be afraid to report "negative" data (e.g., lack of relationships among variables). • If your data seem unreasonable, provide reasons that might help explain this. • If possible, connect your findings with the results from published studies by using literature citations. • DO NOT discuss every aspect of your data and DO NOT provide every conceivable explanation for the obtained results. • Speculation should be limited and clearly identified as your own speculation. • The last paragraph should be a STRONG STATEMENT of the TAKE-HOME MESSAGE.
LITERATURE CITED • All citations that appear in the body of your lab report must be listed in this section. • Use the author-year or numeric format to arrange the citations. • There are many ways of formatting citations. Check with the course instructor.
CITATIONS W/IN THE PAPER • Appropriate literature can be cited in the Introduction, Methods, and Discussion sections. • Citations most commonly appear at the end of a sentence inside parentheses as illustrated in the following examples: • Growth rates are positively correlated with rainfall (Jones 1993). • Growth rates are positively correlated with rainfall (Jones 1993, Roy and Smith 1988). • Growth rates are positively correlated with rainfall (Jones 1993, Roy and Smith 1988, Williams et al. 1937). ** “et al.” shows that Williams had two or more coauthors. All author’s names should appear in the complete citation in the Literature Citation section. • The above format is preferred although some writers will explicitly insert the cited author's name(s) into a sentence: • Jones (1993) found that growth rates are positively correlated with rainfall. • A positive correlation between growth rates and rainfall was found by Jones (1993). • Numeric internal citations can be done in the order they are cited and referenced by number in the literature cited section.
FORMAT FOR VARIOUS SOURCES OF CITATION RESEARCH ARTICLES • Booth, D.A. 1995. Cognitive processes in odorant mixture assessment. Chemical Senses 20:639643. • Drews, D., Vaughn, D.B. and Anfiteatro, A. 1992. Beer consumption as a function of music and the presence of others. Journal of the Pennsylvania Academy of Science 65:134-136. • Keeling, L.J. and Hernia, J.F. 1996. Social facilitation acts more on the appetitive than the consummatory phase of feeding behaviour in domestic fowl. Animal Behaviour 52:1 1-15. BOOK • Schmidt-Nielsen, K. 1990. Animal Physiology: adaptation and environment. 4th ed. Cambridge University Press, New York, NY.
MORE CITATION FORMATTING EDITED VOLUME • Hocutt, C.H., Baily, R. and Stauffer, J.R. 1992. An environmental primer for less developed countries, with an emphasis on Africa. Pages 39-62 in Cairns, J., Jr., Niederlehner, B.R. and OIvos, D.R. (eds.). Predicting Ecosystem Risk. Princeton Scientific Publishing Co., Inc. Princeton, NJ. WORLD WIDE WEB DOCUMENT • Basic information in the citation: Author's name(s). Date of publication. Title of work. Available from: Protocol: address and path. Accessed date of visit. Example: • Collins, F. and Patrinos, A. 1996 August 16. NCHGR---DOE guidance on human subjects in large-scale DNA sequencing [monograph online]. Available from: http://www.ornl.gov/TechResources/Human_Genome/archive/mchgrdoe.html. Accessed 1997 January 6.
MORE CITATION FORMATTING ELECTRONIC JOURNAL ARTICLE • Basic information in the citation: Author's name(s). Date of publication. Title of work. Title of serial [serial online] Volume number: pages. Available from: protocol, address, and path. Example: • Martin, E.P. 1996. Phylogenies, spatial autoregression, and the comparative method: a computer simulation test. Evolution [serial online] 50:1-14. Available from: Infotrac Expanded Academic Index. ELECTRONIC CORRESPONDENCE • Basic information in the citation: Author's name(s). Date of message. Title or subject line [type of medium]. Available from: protocol, address, and path. Examples: • Smith, J. 1997 February 13. Re: Scientific style [email to Keck, A.]. Available from: ajkOO 1 @alpha.momingside.edu • Doe, J. 1997 February 13. Citation formats [discussion online]. Available from: Bibliographic lnstruction List B1-L via listserv@bingvmb. cc.binghamton. edu