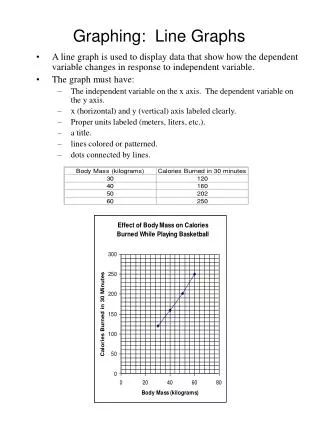
Download

1 / 13
150 likes | 339 Views
Line Graphs. Lets look at some average temperatures from some cities around the world…. Fayetteville, Arkansas. Sydney, Australia. New York, New York. Pretoria, South Africa. Tokyo, Japan. Some Questions…. Which place is the warmest in July? Where is it 71 degrees in June?

E N D
Lets look at some average temperatures from some cities around the world…
Some Questions… • Which place is the warmest in July? • Where is it 71 degrees in June? • Where is it the coldest in January? • What is the temperature in Pretoria in May? • When is it summer in Tokyo? • Who can have a swim party over Christmas break? • Which city has the greatest range of temperatures during a year?
What is a line graph? A line graph is used to display information that shows trends. They often show how something has changed over a period of time. Line graphs are made up of points on the graph that are connected by line segments.
Now, let’s make a line graph using the data that you collected last week in the temperature of water lab.