Download
1 / 1
10 likes | 96 Views
Fig. A3. (a). (b). WT2 . 5E. 700. 2. GM1 . 5B. =. R. 0.9153. CI D. GM1 . 5D. CIIB. WT2 . 5D. WT2 . 5C. CI IA. GM1 . 5C. WT2 . 5A. CI B. 600. GM1 . 5E. GM2 . 5A. WT2 . 5B. GM2 . 5B. GM1 . 5A. GM2 . 5C. WT1 . 5E. 500. CI E. GM2 . 5E. Number of species. WT1 . 5D.

E N D
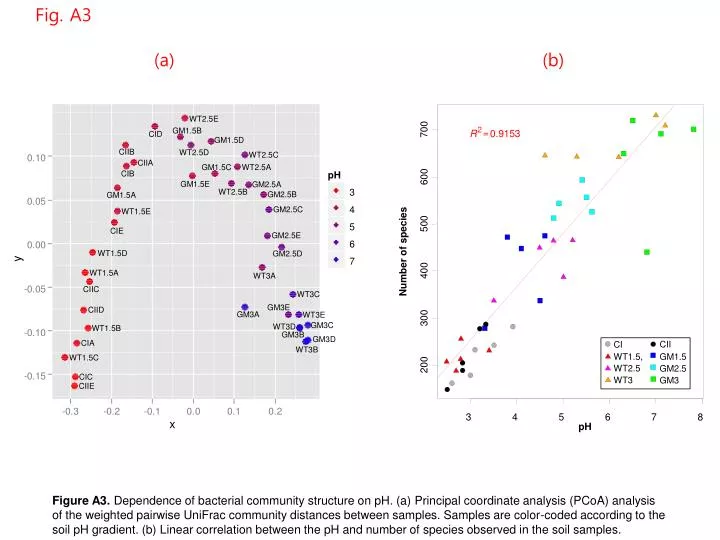
Fig. A3 (a) (b) WT2.5E 700 2 GM1.5B = R 0.9153 CID GM1.5D CIIB WT2.5D WT2.5C CIIA GM1.5C WT2.5A CIB 600 GM1.5E GM2.5A WT2.5B GM2.5B GM1.5A GM2.5C WT1.5E 500 CIE GM2.5E Number of species WT1.5D GM2.5D 400 WT1.5A WT3A CIIC WT3C GM3E CIID GM3A WT3E 300 GM3C WT3D WT1.5B GM3B GM3D CIA CII CI WT3B WT1.5, GM1.5 WT1.5C 200 WT2.5 GM2.5 CIC WT3 GM3 CIIE 3 4 5 6 7 8 pH Figure A3. Dependence of bacterial community structure on pH. (a) Principal coordinate analysis (PCoA) analysis of the weighted pairwise UniFrac community distances between samples. Samples are color-coded according to the soil pH gradient. (b) Linear correlation between the pH and number of species observed in the soil samples.