Download
1 / 7
120 likes | 577 Views
We will look at Simple Index Numbers Chain base index numbers Weighted index numbers Retail Price index. Simple Index Numbers These are used to see how the price of things vary over time.

E N D
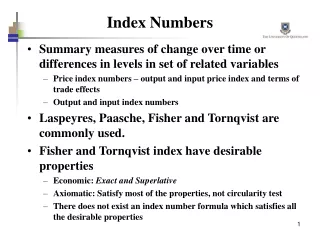
We will look at • Simple Index Numbers • Chain base index numbers • Weighted index numbers • Retail Price index
Simple Index Numbers • These are used to see how the price of things vary over time. • There is always a starting year from which you consider the change in prices. This is called the base year. • The base year has the index number 100. • The simple index number tells you the percentage change since the base year. • Examples • If the base year was 2002 (index number 100) and the simple index number for 2005 is 107 then there has been a rise of 7% between 2002 and 2005. • If the simple index number for 2008 is 94 then there has been a drop of 6% between 2002 and 2008. • Formulae • Simple index number = x 100
Example • The table gives information about the mean price, to the nearest £1000, of terraced houses in the north-west in March 2005 and March 2008. • taking 2005 as the base year, work out the index number for the mean price of terraced houses in the north-west in 2008. Give your answer to the nearest whole number • Using 2005 as the base year, the index number of the mean price of terraced houses for March 2009 was 110. • By what percentage has the mean price of terraced houses change between 2005 and 2009? • Work out the mean price of terraced houses in 2009 • Describe in words what has happened to house prices over the years between 2005 and 2009 Index number = x 100 = 118.75 index number = 119 to nearest whole number 10% Mean price is 80 000 + (10% of 80 000) = £80 000 + £8 000 = £88 000 The prices increased between 2005 and 2008 but dropped between 2008 and 2009
Chain base Index Numbers • These are used to see how the price each year compares with the previous year. • Formulae • Chain base index number = x 100 • Example • The table shows the price of a camera over 4 years • The chain base index numbers for 2008 and 2009 are: • For 2008 x 100 = 114.3 for 2009 x 100 = 90 • The price between 2007 and 2008 went up by 14.3% • The price between 2008 and 2009 went down by 100 – 90 = 10%
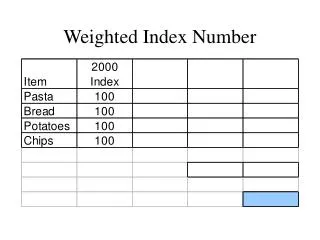
Weighted Index Numbers • These are a way of comparing weighted means • Formulae • Weighted index number = x 100 • Example • The weighted mean for the cost of a bag of groceries in 2009 was 140p • The weighted mean for the same bag of groceries in 2007 was 125p. • The weighted index number for the price of this bag of groceries in 2009. taking 2007 as the base year is • x 100 = 112 • Price has gone up 12%
Retail Price index • This is a weighted index number that shows how the price of a basket of groceries changes from year to year. • It is commonly used for updating old age pensions • It is also used for wage bargaining • The index includes the following categories • Food and catering • Alcohol and tobacco • Housing and household expenditure • Personal expenditure • Travel and leisure • Page 157 for a nice pie chart
Your turn Exercise 4K page 158