Download
1 / 16
170 likes | 317 Views
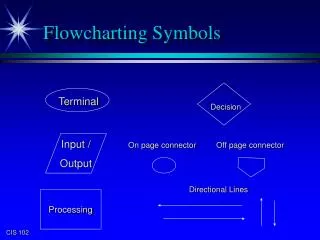
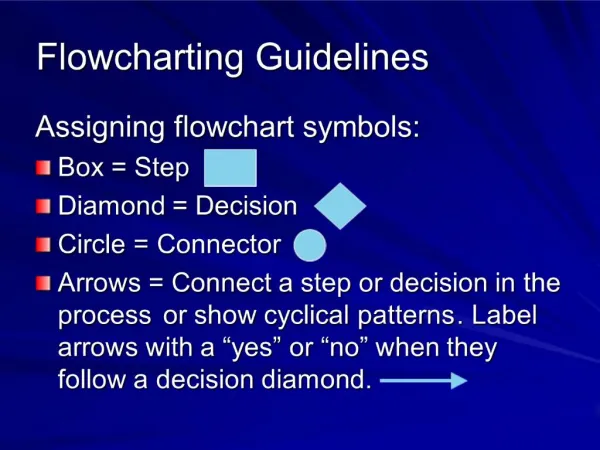
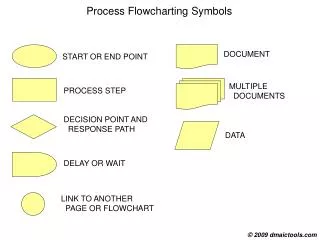
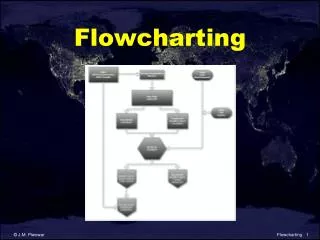
Flowcharting. What is Flowcharting?. Is a graphical representation of the logical sequence of steps to be performed in a program. It contains all the three stages of data processing namely: Input Process and Output. General Input/Output Symbol Decision Symbol Flowline Symbol.

E N D
What is Flowcharting? • Is a graphical representation of the logical sequence of steps to be performed in a program. • It contains all the three stages of data processing namely: • Input • Process and • Output
General Input/Output Symbol • Decision Symbol • Flowline Symbol
Process Symbol • Terminal Symbol
Flowchart Control Structures • Control structures are necessary to organize the flow of control in a program, in order to provide discipline in the development of a program design. These structures are also referred to as “single-entry, single-exit” structures. They do not allow arbitrary transfer to any other structure without passing the exit point. The combination of these structures are the building blocks of flowcharts and program coding.
Sequence Structure • The sequence structure indicates that control flows from one processing to another. • It represent events that occur immediately one after another. The statements are execute sequentially in the order in which they appear in the program.
Sequence Structure BEGIN Input Data Process Data Output Data End
Num1=0 Sum=0 Num2=0 Ave=0 Num3=0 Example 1:Make a flowchart that will input three numbers, compute its sum and average and display it on screen. Begin Input Num1, Num2, Num3 Compute Sum=Num1+Num2+Num3 Compute Ave=(Num1+Num2+Num3)/3 Display “The sum is”, Sum “The average is”, Ave End
Selection Structure • Is used to test a condition and provide for a choice between two alternatives. They entry point is by means of the condition that has to be tested. Based on the outcome of the condition tested, program control branches out to either true/yes segment of the program or to a false/no segment. If the condition is satisfied, then the program will branch to the true/yes segment will be executed and the flow goes to the exit. If the condition is not satisfied, then it will branch to the false/no segment and the flow goes to the exit.
Selection Structure BEGIN Input Data Condition Process Data Process Data Output Data END
Example 2:Make a flowchart that determines the larger and smaller number between two input numbers and output the results BEGIN Input A, B False If A > B Big = B Small = A True Big = A Small = B END
Repetition/Iteration or Looping Structure • The iteration or looping structure occurs when an event is repeatedly performed as long as a given condition is true or is false as the case may be. The iteration structure provides a means of repeating a part of the computation/instruction. It is therefore, useful for processing a large number of records or data that require the same process.
Repetition/Iteration or Looping Structure entry Previous Statements Body of the Loop Loop – Exit Condition Yes No
Example 3:Create a program that allows the user to input his name and the program should display/output his name 10 times on the computer screen Begin End Yes If Loop > 10 Then Input Name Loop:=Loop +1 No Write Name Loop:=1
Hands-on Activities • Make a flowchart that computes the sum from 1 to 50 and displays its sum. • Make a flowchart on how to process a cup of coffee. (No hot water available yet). • Make a flowchart that inputs the name and the age of the user and it will display the message “You are too young to fall in love” if age is less than 16. • Write a flowchart that will test if the input number is divisible by2. • Write the flowchart that will input 5 of your favorite songs and will store it in the diskette. (note: use store data symbol for storing the songs in he diskette.)