Download
1 / 68
790 likes | 1.2k Views
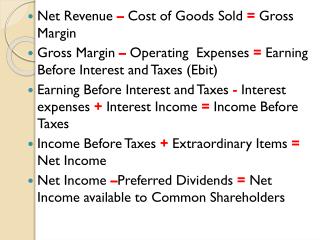
Chapter 8. INVENTORIES AND THE COST OF GOODS SOLD. Goods owned and held for sale to customers. Current asset. Inventory Defined. Inventory. BALANCE SHEET. Current assets:. Inventory. $. $. INCOME STATEMENT. Revenue. $. Cost of goods sold. Gross profit. Expenses.

E N D
Chapter8 INVENTORIES AND THE COST OF GOODS SOLD
Goods ownedand held for saleto customers Current asset Inventory Defined Inventory
BALANCE SHEET Current assets: Inventory $ $ INCOME STATEMENT Revenue $ Cost of goods sold Gross profit Expenses Net income The Flow of Inventory Costs As purchase cost (or manufacturing costs) are incurred as goods are sold
The Flow of Inventory Costs In a perpetual inventory system, inventory entries parallel the flow of costs.
Which Unit Did We Sell? When identical units of inventory have different unit costs, a question naturally arises as to which of these costs should be used in recording a sale of inventory.
A separate subsidiary account is maintained for each item in inventory. Inventory Subsidiary Ledger How can we determine the unit cost for the Sept. 10 sale?
Average cost Specific identification FIFO LIFO Inventory Cost Flows We use one of these inventory valuation methods to determine cost of inventory sold.
Information for the Following Inventory Examples The Bike Company (TBC)
Specific Identification When a unitis sold, the specific cost of the unit sold is added to cost of goods sold.
Continue Specific Identification On August 14, TBC sold 20 bikes for $130 each. Nine bikes originally cost $91 and 11 bikes originally cost $106.
Continue Specific Identification The Cost of Goods Sold for the August 14 sale is $1,985, leaving $515 and 5 units in inventory. Let’s look at the entries for the Aug. 14 sale.
Retail Cost Continue Specific Identification A similar entry ismade after each sale.
Continue Specific Identification Cost of Goods Sold for August 31 = $2,610 Additional purchases were made on August 17 and 28. Costs associated with sales on August 31 were as follows: 1 @ $91, 3 @ $106, 15 @ $115, & 4 @ $119.
Specific Identification Income Statement COGS = $4,595 Balance Sheet Inventory = $1,395
Not really. Specific identification is hard to use when we sell a lot of inventory that has lots of different costs. Since specific identification is so easy, can’t we use it all the time?
Cost of Goods Available for Sale Units on hand on the date of sale Average-Cost Method When a unit is sold,theaverage cost of each unitin inventory is assigned to costof goods sold. ÷
Continue Average-Cost Method The average cost per unit must be computed prior to each sale. $100 = $2,500 25 On August 14, TBC sold 20 bikes for $130 each.
Continue Average-Cost Method The average cost per unit is $100. $100 = $2,500 25 Let’s look at the entries for the Aug. 14 sale.
Retail Cost Continue Average-Cost Method A similar entry ismade after each sale.
Continue Average-Cost Method Additional purchases were made on August 17 and August 28. On August 31, an additional 23 units were sold.
Average-Cost Method $114 = $3,990 35
Average-Cost Method The average cost per unit is $114. $114 = $3,990 35
Income Statement COGS = $4,622 Average-Cost Method Balance Sheet Inventory = $1,368 $114 × 12 = $1,368
Oldest Costs Recent Costs First-In, First-Out Method (FIFO) Costs of Goods Sold Ending Inventory
Continue First-In, First-Out Method (FIFO) The Cost of Goods Sold for the August 14 sale is $1,970, leaving $530 and 5 units in inventory. On August 14, TBC sold 20 bikes for $130 each.
Retail Cost Continue First-In, First-Out Method (FIFO) A similar entry ismade after each sale.
Continue First-In, First-Out Method (FIFO) Additional purchases were made on Aug. 17 and Aug. 28. On August 31, an additional 23 units were sold. Cost of Goods Sold for August 31 = $2,600
First-In, First-Out Method (FIFO) Income Statement COGS = $4,570 Balance Sheet Inventory = $1,420
Recent Costs Oldest Costs Last-In, First-Out Method (LIFO) Costs of Goods Sold Ending Inventory
Continue Last-In, First-Out Method (LIFO) The Cost of Goods Sold for the August 14 sale is $2,045, leaving $455 and 5 units in inventory. On August 14, TBC sold 20 bikes for $130 each.
Retail Cost Continue Last-In, First-Out Method (LIFO) A similar entry ismade after each sale.
Continue Last-In, First-Out Method (LIFO) Additional purchases were made on Aug. 17 and Aug. 28. On Aug. 31, an additional 23 units were sold.
Continue Last-In, First-Out Method (LIFO) Cost of Goods Sold for August 31 = $2,685
Last-In, First-Out Method (LIFO) Income Statement COGS = $4,730 Balance Sheet Inventory = $1,260
The Principle of Consistency Once a company has adopted a particular accounting method, it should follow that method consistently, rather than switch methods from one year to the next.
Just-In-Time (JIT) Inventory Systems This inventory arrived just in time for us to use it in the manufacturing process.
Taking a Physical Inventory The primary reason for taking a physical inventory is to adjust the perpetual inventory records for unrecorded shrinkage losses, such as theft, spoilage, or breakage.
Reduces the value of the inventory. Obsolescence Lower of Cost or Market (LCM) Adjust inventory value to the lower of historical cost or current replacement cost (market). LCM and Other Write-Downsof Inventory
Goods In Transit A sale should be recorded when title to the merchandise passes to the buyer. F.O.B. shipping point title passes to buyer at the point of shipment. F.O.B. destination point title passes to buyer at the point of destination. Year End
Periodic Inventory Systems In a periodic inventory system, inventory entries are as follows. Note that an entry is not made to inventory.
Periodic Inventory Systems In a periodic inventory system, inventory entries are as follows.
Periodic Inventory Systems The inventory on hand and the cost of goods sold for the year are not determined until year-end.
Average cost Specific identification FIFO LIFO Periodic Inventory Systems We use one of these inventory valuation methods in a periodic inventory system.
Specific Identification By reviewing actual purchase invoices, Computers, Inc. determines that the 1,200 mouse pads on hand at year-end have an actual total cost of $6,400. Determine the cost of goods sold for the year.
Specific Identification Cost of Goods Sold $9,725 - $6,400 = $3,325
Total Cost of Goods Available for Sale Total Number of Units Available for Sale Average-Cost Method The average cost is calculated at year-end as follows: ÷
Average-Cost Method Avg. Cost $9,725 1,800 = $5.40278 Ending Inventory Avg. Cost $5.40278 1,200 = $6,483 Cost of Goods Sold Avg. Cost $5.40278 600 = $3,242
Oldest Costs Recent Costs First-In, First-Out Method (FIFO) Costs of Goods Sold Ending Inventory