Download
1 / 58
610 likes | 876 Views
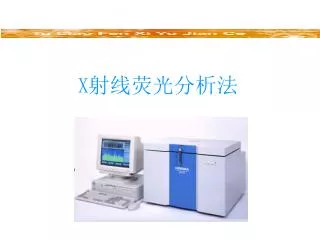
X 射线荧光分析法. 1.X 射线荧光光谱法简介 2. 方法和原理 3. 仪器结构和原理. 电磁波频谱. Theory. A source X-ray strikes an inner shell electron. If at high enough energy (above absorption edge of element), it is ejected it from the atom.

E N D
1.X射线荧光光谱法简介 • 2.方法和原理 • 3.仪器结构和原理
Theory • A source X-ray strikes an inner shell electron. If at high enough energy (above absorption edge of element), it is ejected it from the atom. • Higher energy electrons cascade to fill vacancy, giving off characteristic fluorescent X-rays. • Higher energy electrons cascade to fill vacancy, giving off characteristic fluorescent X-rays. • For elemental analysis of Na - U.
X射线荧光光谱法是利用样品对x射线的吸收随样品中的成分及其众寡变化而变化来定性或定量测定样品中成分的一种方法.X射线荧光光谱法是利用样品对x射线的吸收随样品中的成分及其众寡变化而变化来定性或定量测定样品中成分的一种方法. • 它具有分析迅速、样品前处理简单、可分析元素范围广、谱线简单,光谱干扰少等优点. • x射线荧光法不仅可以分析块状样品,还可对多层镀膜的各层镀膜分别进行成分和膜厚的分析. 返回
当试样受到x射线,高能粒子束,紫外光等照射时,由于高能粒子或光子与试样原子碰撞,将原子内层电子逐出形成空穴,使原子处于激发态,这种激发态离子寿命很短,当外层电子向内层空穴跃迁时,多余的能量即以x射线的形式放出,并在较外层产生新的空穴和产生新的x射线发射,这样便产生一系列的特征x射线。当试样受到x射线,高能粒子束,紫外光等照射时,由于高能粒子或光子与试样原子碰撞,将原子内层电子逐出形成空穴,使原子处于激发态,这种激发态离子寿命很短,当外层电子向内层空穴跃迁时,多余的能量即以x射线的形式放出,并在较外层产生新的空穴和产生新的x射线发射,这样便产生一系列的特征x射线。
Information from a spectrum X-ray Intensity (cps) X-ray Energy (keV) X-ray Energy (keV) Element X-ray Intensity (cps) Concentration
特征x射线是各种元素固有的,它与元素的原子系数有关。两者有这样的关系:特征x射线是各种元素固有的,它与元素的原子系数有关。两者有这样的关系: 式中k,S是常数,所以只要测出了特征x射线的波长λ,就可以求出产生该波长的元素。即可做定性分析。
当用x射线(一次x射线)做激发源照射试样,使试样中元素产生特征x射线(荧光x射线)时,若元素和实验条件一样,荧光x射线的强度Ii与分析元素的质量百分浓度Ci的关系可以用下式表示:当用x射线(一次x射线)做激发源照射试样,使试样中元素产生特征x射线(荧光x射线)时,若元素和实验条件一样,荧光x射线的强度Ii与分析元素的质量百分浓度Ci的关系可以用下式表示: • 式中μm是样品对一次x射线和荧光射线的总质量吸收系数,K为常数,与入射线强度I和分析元素对入射线的质量吸收系数有关。 • 在一定条件下(样品组成均匀,表面光滑平整,元素见无相互激发),荧光x射线强度与分析元素含量之间存在线性关系。根据谱线的强度可以进行定量分析 返回
波长色散型谱仪原理 特征X射线用准直器准直,投射到分光晶体的表面,按照布拉格定律产生衍射,使不同波长的荧光x射线按波长顺序排列成光谱。这些谱线由检测器在不同的衍射角上检测,转变为脉冲信号,经电路放大,最后由计算机处理输出。
Sample Fluorescent X-ray Detector CCD Camera X-ray Guide tube Primary X-ray
Side Window X-Ray Tube Be Window Glass Envelope HV Lead Target (Ti, Ag, Rh, etc.) Electron beam Copper Anode Filament Silicone Insulation
x射线管产生的x射线由两部分组成:具有连续波长成分的连续x射线和具有靶材料元素特性波长的特征x射线。x射线管产生的x射线由两部分组成:具有连续波长成分的连续x射线和具有靶材料元素特性波长的特征x射线。 • 连续x射线的产生是由于x射线管内高速运动的电子撞击靶原子后受到阻尼,将部分能量传递给靶材料原子,引起轫致辐射所致。 • 当x射线管的加速电压提高到某一临界值时,就会在连续波长的某些波长位置出现强度很大的线状光谱。这些线状光谱取决于靶材原子,而与入射电子的能量无关。他反映靶材元素的性质,所以成为特征x射线。
Isotope Fe-55 Cm-244 Cd-109 Am-241 Co-57 Energy (keV) 5.9 14.3, 18.3 22, 88 59.5 122 Elements (K-lines) Al – V Ti-Br Fe-Mo Ru-Er Ba - U Elements (L-lines) Br-I I- Pb Yb-Pu None none Radioisotopes • While isotopes have fallen out of favor they are still useful for many gauging applications.
分光系统 • 分光系统由入射狭缝,分光晶体,晶体旋转机构,样品室和真空系统组成。其作用是将试样受激发产生的二次x射线(荧光x射线)经入射狭缝准直后,投射到分光晶体上。晶体旋转机构使分光晶体转动,连续改变θ角,使各元素不同波长的x射线按布拉格定律分别发生衍射而分开,经色散产生荧光光谱。 • 当x射线入射到物质中时,其中一部分会被物质原子散射到各个地方去。当被照射的物质为晶体时,其原子在三为空间有规则排列,且原子层见的间距与照射x射线波长有相同数量级时,在某种条件下,散射的x射线会得到加强,显示衍射现象。当晶面距离为d,入射和反射x射线波长为λ时,有相临两个晶面反射出的两个波,其光程差为2dsinθ,当该光程差为x射线的整数倍时,反射出的x射线相位一致,强度增强,为其他值时,强度互相抵消而减弱。所以只有满足2dsinθ=nλ时,即波长为λ的一级x射线及λ/2,λ/3…的高级衍射线在出射角θ方向产生衍射,从而达到分光的目的。
检测和分光系统包括出射狭缝,检测器,放大器,脉高分析器等组成部分。对荧光x射线进行扫描和检测。检测和分光系统包括出射狭缝,检测器,放大器,脉高分析器等组成部分。对荧光x射线进行扫描和检测。
Si(Li) Detector FET Window Super-Cooled Cryostat Dewar filled with LN2 Si(Li) crystal Pre-Amplifier Cooling: LN2 or Peltier Window: Beryllium or Polymer Counts Rates: 3,000 – 50,000 cps Resolution: 120-170 eV at Mn K-alpha
PIN Diode Detector Cooling: Thermoelectrically cooled (Peltier) Window: Beryllium Count Rates: 3,000 – 20,000 cps Resolution: 170-240 eV at Mn k-alpha
Silicon Drift Detector- SDD Packaging: Similar to PIN DetectorCooling: Peltier Count Rates; 10,000 – 300,000 cpsResolution: 140-180 eV at Mn K-alpha
Proportional Counter Window Anode Filament Fill Gases: Neon, Argon, Xenon, Krypton Pressure: 0.5- 2 ATM Windows: Be or Polymer Sealed or Gas Flow Versions Count Rates EDX: 10,000-40,000 cps WDX: 1,000,000+ Resolution: 500-1000+ eV
Scintillation Detector PMT (Photo-multiplier tube) Electronics Sodium Iodide Disk Window: Be or Al Count Rates: 10,000 to 1,000,000+ cps Resolution: >1000 eV Connector
Polymer Detector Windows • Optional thin polymer windows compared to a standard beryllium windows • Affords 10x improvement in the MDL for sodium (Na)
Wavelength Dispersive XRF Wavelength Dispersive XRF relies on a diffractive device such as crystal or multilayer to isolate a peak, since the diffracted wavelength is much more intense than other wavelengths that scatter of the device. Sample Detector Collimators X-Ray Source Diffraction Device
Typical Si(Li) Detector Instrument This has been historically the most common laboratory grade EDXRF configuration.
Typical PIN Detector Instrument This configuration is most commonly used in higher end benchtop EDXRF Instruments.
Energy Dispersive Electronics Fluorescence generates a current in the detector. In a detector intended for energy dispersive XRF, the height of the pulse produced is proportional to the energy of the respective incoming X-ray. Signal to Electronics DETECTOR Element A Element B Element C Element D
Multi-Channel Analyser • Detector current pulses are translated into counts (counts per second, “CPS”). • Pulses are segregated into channels according to energy via the MCA (Multi-Channel Analyser). Intensity (# of CPS per Channel) Channels, Energy Signal from Detector
K & L Spectral Lines L beta • K - alpha lines:L shell e- transition to fill vacancy in K shell. Most frequent transition, hence most intense peak. L alpha K beta • K - beta lines:M shell e- transitions to fill vacancy in K shell. K alpha • L - alpha lines:M shell e- transition to fill vacancy in L shell. K Shell L Shell M Shell • L - beta lines:N shell e- transition to fill vacancy in L shell. N Shell
K & L Spectral Peaks K-Lines L-lines Rh X-ray Tube
Qualitative Scan Peak ID Automated Peak identification programs are a useful qualitative examination tool Element Tags • This spectrum also contrasts the resolution of a PIN diode detector with a proportional counter to illustrate the importance of detector resolution with regard to qualitative analysis.
The algorithm computes both the intensity to concentration relationship and the absorption affects Results are typically within 10 - 20 % of actual values. Semi-Quantitative Analysis SLFP Standardless Fundamental Parameters FP (with Standards) NBS-GSC, NRLXRF, Uni-Quant, TurboQuant, etc… • The concentration to intensity relationship is determined with standards, while the FP handles the absorption affects. • Results are usually within 5 - 10 % of actual values
Quantitative Analysis XRF is a reference method, standards are required for quantitative results. Standards are analysed, intensities obtained, and a calibration plot is generated (intensities vs. concentration). XRF instruments compare the spectral intensities of unknown samples to those of known standards. Concentration Intensity
Standards • Standards (such as certified reference materials) are required for Quantitative Analysis. • Standard concentrations should be known to a better degree of precision and accuracy than is required for the analysis. • Standards should be of the same matrix as samples to be analyzed. • Number of standards required for a purely empirical method, N=(E+1)2, N=# of standards, E=# of Elements. • Standards should vary independently in concentration when empirical absorption corrections are used.
Sample Preparation • Powders: • Grinding (<400 mesh if possible) can minimise scatter affects due to particle size. Additionally, grinding insures that the measurement is more representative of the entire sample, vs. the surface of the sample. • Pressing (hydraulically or manually) compacts more of the sample into the analysis area, and ensures uniform density and better reproducibility.. • Solids: • Orient surface patterns in same manner so as minimise scatter affects. • Polishing surfaces will also minimise scatter affects. • Flat samples are optimal for quantitative results. • Liquids: • Samples should be fresh when analysed and analysed with short analysis time - if sample is evaporative. • Sample should not stratify during analysis. • Sample should not contain precipitants/solids, analysis could show settling trends with time.
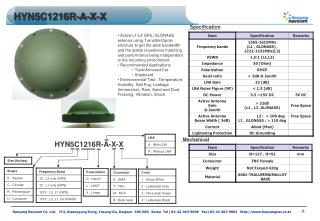
3 pieces 1 Piece Advantage of φ1.2mm irradiation • Beam size should fit to sample size Sample : Cable,Φ2mm XGT-1000WR Previous model Φ5mm Φ1.2mm Three-Cables One -Cable
Direct analysis of small samples Most of the electric parts are small X-ray focused on 1.2mm diameter enable to measure these samples without special preparation
Setting the sample Measurement ① ② Measurement result ③ Data transmit to Excel file Measurement Procedure
Maintenance 1. Place the maintenance sample 2. Set up the maintenance mode 3. Push start button Energy Intensity
Pb is found Cd is found No Pb/Cd Typical Application: Mobile phone charger 550ppm cable 88ppm Colored part charger 【conditions】 X-ray tube voltage : 50kV X-rau tube current : 1.0mA Measurement time : 100sec
质 谱 法 质谱法是通过将样品转化为运动的气态离子并按 质荷比(m/z)大小 进行分离记录的分析方法。所获得结果即为质谱图(亦称质谱)。根据质谱图提供的信息可以进行多种有机物及无机物的定性和定量分析、复杂化合物的结构分析、样品中各种同位素比的测定及固体表面的结构和组成分析等。
质 谱 仪 一、质谱仪的工作原理 质谱仪是利用电磁学原理,使带电的样品离子按质荷比进行分离的装置。离子电离后经加速进入磁场中,其动能与加速电压及电荷 z 有关,即 z e U = 1/2 m 2 其中z为电荷数,e为元电荷(e=1.60×10⁻¹⁹C),U为加速电压,m为离子的质量, 为离子被加速后的运动速度。 具有速度的带电粒子进入质谱分析器的电磁场中,根据所选择的分离方式,最终实现各种离子按m/z进行分离。