Download
1 / 23
230 likes | 381 Views
Dynamic Visualization of Transient Data Streams. P. Wong, et al The Pacific Northwest National Laboratory Presented by John Sharko Visualization of Massive Datasets. Characteristics of Data Streams. Arrives continuously Arrives unpredictably Arrives unboundedly

E N D
Dynamic Visualization of Transient Data Streams P. Wong, et al The Pacific Northwest National Laboratory Presented by John Sharko Visualization of Massive Datasets
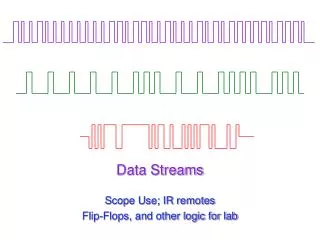
Characteristics of Data Streams • Arrives continuously • Arrives unpredictably • Arrives unboundedly • Arrives without persistent patterns
Examples of Data Streams • Newswires • Internet click streams • Network resource management • Phone call records • Remote sensing imagery
Visualization Problem • Fusing a large amount of previously analyzed information with a small amount of new information • Reprocess the whole dataset in full detail
First Objective • Achieve the best understanding of transient data when influx rate exceed processing rate Approach: Data stratification to reduce data size
Second Objective • Incremental visualization technique Approach: Project new information incrementally onto previous data
Primary Visualization OutputMultidimensional Scaling OJ Simpson trial Oklahoma bombing French elections
Methods for Adaptive Visualization • Vector dimension reduction • Vector sampling
Vector Dimension Reduction Approach: dyadic wavelets (Haar) 200 terms 100 terms 50 terms
Results of Vector Dimension Reduction 50 200 100 Dimensions
Results of Vector Sampling 3298 824 1649 Number of Documents
Scatterplot Similarity Matching Procrustes Analysis Results
Incremental Visualization Using Fusion • Reprocessing by projecting new items onto existing visualization • Feature: reprocessing the entire dataset is often not required
Hyperspectral Image Processing • Apply MDS to scale pixel vectors • K-mean process to assign unique colors • Stratify the vectors progressively
Robust Eigenvectors Generate three MDS scatter plots for each third of the image
Robust Eigenvectors (cont’d) Generate MDS scatterplot for entire dataset
Robust Eigenvectors (cont’d) Extract points from cropped areas
Using Multiple Sliding Windows Eigenvectors determined by the long window New vectors are projected using the Eigenvectors of the long window Sliding Direction Data Stream Long Window Short Window
Dynamic Visualization Steps 1. When influx rate < processing rate, use MDS 2. When influx rate > processing rate, halt MDS 3. Use multiple sliding windows for pre-defined number of steps 4. Use stratification approach for fast overview 5. Check for accumulated error using Procrustes analysis 6. If error threshold not reached, go to step 3 If error threshold reached, go to step 1
Conclusions • The data stratification approach can substantially accelerate visualization process • The data fusion approach can provide instant updates