Download
1 / 13
130 likes | 220 Views
Demand overall: change in 2012 week 27 is clear. 25% rise since mid 2012 to early 2013 is surprising. Has a change in list size made a difference? If the list is 10,400, demand at 10% pw is very high. But f2f of 20% is low. Demand over 1000 calls pw.

E N D
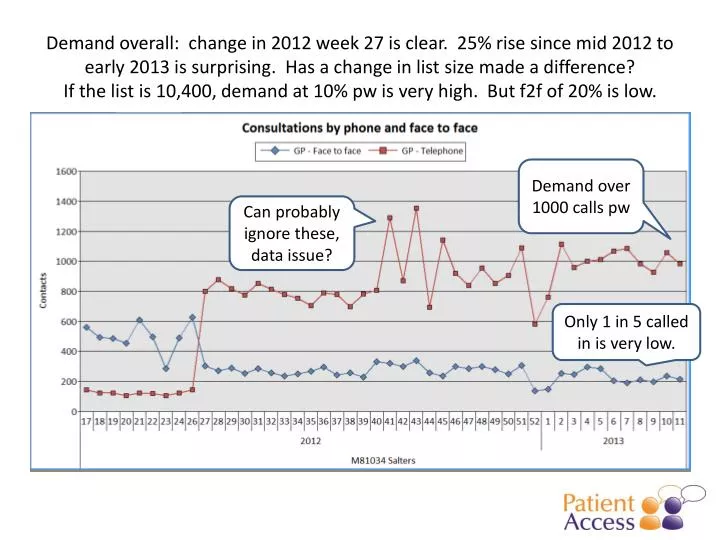
Demand overall: change in 2012 week 27 is clear. 25% rise since mid 2012 to early 2013 is surprising. Has a change in list size made a difference?If the list is 10,400, demand at 10% pw is very high. But f2f of 20% is low. Demand over 1000 calls pw Can probably ignore these, data issue? Only 1 in 5 called in is very low.
Waiting days to see GP f2f: low before change, they have stayed low.Telephone also low, mostly same day, ignore spikes 41/43/45, prob data issue Can probably ignore these, data issue?
Nearly 90% of patients choose to book same day f2f - impressive
Pattern of demand through the day: large spike at 8.30am suggests patients feel it is hard to get access, but there is some through day. Inset: before change, even higher spike, things have improved.
Challenge is now to meet demand with supply, precisely, by day and hour. With big early peaks each day, difficult
Currently the supply is not closely matched. Patients more predictable than GPs. Some calls up to 8pm – long days.
By working day, supply needs to reflect the variation, with Monday much higher, as expected.
Since the change, response time has gradually lengthened as demand has grown. Difficult for patients and GPs. This could be halved. Steady rise in response time is demoralising for staff and patients
The picture as a frequency chart, last four weeks. Median time is about 80 mins, with some calls waiting up to 6 hours. Needs to be all moved to left. These can all be shifted to the left
Duration of consults: telephone is stable 4-5 mins. F2f has risen from 8 to 12, perhaps reflecting low rate of conversion?
Continuity, chance of seeing same doctor and important for managing demand, rose and then fell as demand as increased.
Summary findings • The change in July 2012 has had a marked effect on waits, but also on demand. • It is surprising to see that demand has risen to such a high level as 10% of list. Compare case studies such as The Elms, Thurmaston • Response times have lengthened and there is evidence of long days. Supply is not tightly coupled to demand, resulting in slow response which affects patient satisfaction, workload and GP morale. We have seen demand fall as response speeds up. • Duration of consults is normal, not sure why f2f has risen, and conversion to f2f is on the low end. • Continuity has risen and fallen again. Good continuity can help manage demand as well as improve care. • What to do: • Understand demand by day/hour/minute and match with supply • Ensure all phone demand is dealt with fast – callbacks sacrosanct • Look at details of GP schedules and how rota is managed
Which is the best pancake? Hot, fresh and crispy Cold and soggy