Download
1 / 10
100 likes | 264 Views
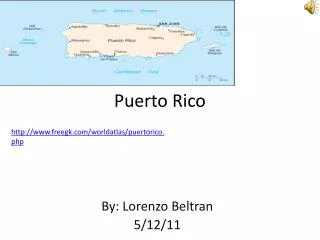
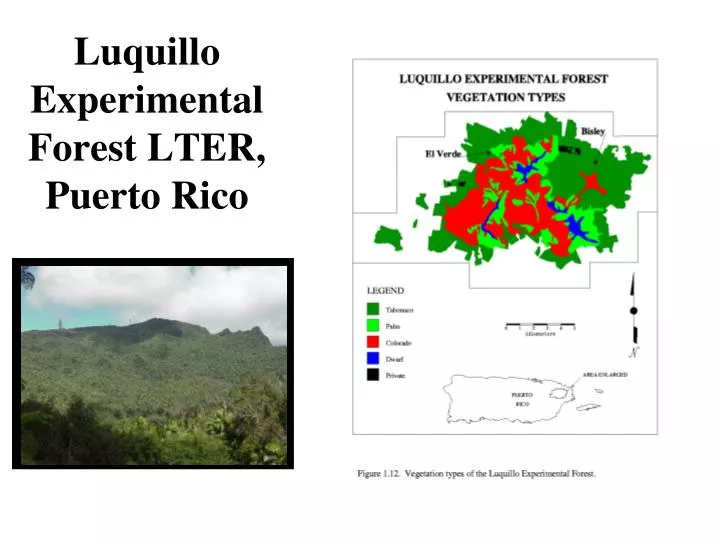
Luquillo Experimental Forest LTER, Puerto Rico. Greater Caribbean Basin. Numbers in the map refer to: 1. Los Tuxtlas 2. Santa Rosa 3. Monteverde 4. La Selva Biological Station 5. Turrialba 6. Barro Colorado Island 7. Estación Biológica de los Llanos 8. Henry Pittier Biological Station

E N D
Greater Caribbean Basin Numbers in the map refer to: 1. Los Tuxtlas 2. Santa Rosa 3. Monteverde 4. La Selva Biological Station 5. Turrialba 6. Barro Colorado Island 7. Estación Biológica de los Llanos 8. Henry Pittier Biological Station 9. San Juan River mangrove system 10. Guánica Forest 11. Luquillo Experimental Forest 12. Everglades 13. Yucatan Project
1936 1964 1988 Fig. 1.8. Forest cover in the LEF in 1936, interpreted using aerial photographs (Foster et al. 1999). Most areas on the flanks off the Luquillo Mountains were deforested or severely affected by agriculture and logging. Many of these areas were in private hands until 1934, when they were purchased by USDA Forest Service. Forest cover in most of these areas is now >80%, though species composition reflects the legacy of human land use (Garcia-Montiel and Scatena 1994, Zimmerman et al. 1995, Thompson et al., in review)
Fig. 1.10. Several hurricanes have passed over or near the LEF in the since Hurricane Hugo. Each storm caused a pulses of litter to be deposited on the forest floor, much in excess of the long-term daily average (2.35 g m-2 d-1; see Fig. 1.16).
Figure 1.3. Distribution of hurricane impacts to Puerto Rico 1886 – 1996. The figure shows the frequency of storms with a wind intensity of at least F2 on the Fujita scale. The LEF, located in the NE corner of Puerto Rico, lies in one of the most frequently damaged areas of the island.
Figure 1.2. Summation of maximum hurricane exposure in the LEF from 1886 – 1996, estimated using the HURRECON and EXPOSE models (Boose et al. 1994, Boose et al. in preparation). HURRECON estimates storm meteorology using information from detailed studies of recent storms and EXPOSE accounts for topographic exposure. By examining historical records of damage, hurricane effects can be placed on the Fujita scale (F0 – F5). In the LEF, most areas have been exposed to maximum winds in categories F2 (extensive blowdowns) and F3 (forest nearly completely damaged), with only isolated valleys protected from these extremely damaging winds. Average return intervals for F2 winds is 22 years and F3 winds is 111 years.
Hurricane Hugo 1989 Extensive damage, with a few protected areas Large input of boles, branches, and litter
Before Hurricane Hugo, 1989 Same spot 2 weeks after Hugo
Changes in litter inputs with hurricanes Total litter and fruits in the Bisley watersheds per 2-week collection period. Note log scale.