Download
1 / 2
20 likes | 136 Views
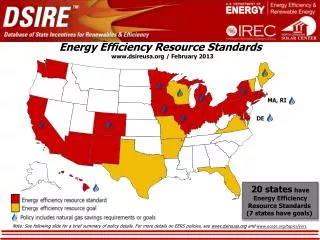
Discover the energy efficiency goals in 20 U.S. states, including targets for electricity and gas sales reductions, peak demand mitigation, and savings by specific years. Learn more at www.dsireusa.org and www.aceee.org.

E N D
Energy Efficiency Resource Standards. www.dsireusa.org / February 2013 20 stateshave Energy Efficiency Resource Standards. (7 states have goals). Note: See following slide for a brief summary of policy details. For more details on EERS policies, see www.dsireusa.org and www.aceee.org/topics/eers.
EERS Policy Details • Iowa: Varies by utility. • Maine: 30% reduction of electricity and natural gas sales by 2020. • Maryland: 15% reduction in per capita energy consumption by 2015, compared to 2007; 15% reduction in per capital peak demand by 2015, compared to 2007. • Massachusetts: Reduce 1,103 GWh electricity in 2012 (statewide); reduce 24.7 million therms by 2012 (statewide). • Michigan: 1.0% annual reduction of previous year retail electricity sales by 2012; 0.75% annual reduction of previous year retail natural gas sales by 2012. • Minnesota: 1.5% reduction of previous 3-year average retail electric sales by 2010; 1.5% reduction of previous 3-year average retail natural gas sales by 2010. • Missouri : 9.9% cumulative electricity savings by2020; an additional 1.9% each year thereafter.9% cumulative peak reduction by 2020; an additional 1% each year thereafter. • New Mexico: 10% of 2005 total retail kWh sales by 2020. • New York: 15% reduction relative to projected electricity use in 2015; gas savings of 112 Bcf annually by 2020. • Ohio: 22.0% reduction of previous 3-year average retail electricity sales by 2025. • Pennsylvania: 3% of projected June 2009 - May 2010 electricity consumption by May 31, 2013; 4.5% of measured June 2007 - May 2008 peak demand by May 31, 2013. • Rhode Island: Varies by utility. • Texas: 25% reduction in annual growth in demand 2012; 30% reduction in annual growth in demand 2013. • Vermont: 320,000 MWh electricity savings (3-year goal for 2012, 2013, 2014); summer peak kW savings: 60,800 (3-year goal for 2012, 2013, 2014). • Virginia: 10% electricity savings by 2022 relative to 2006 base sales. • Washington: Varies by utility. • Wisconsin:2011-2014: Net annual electric energy savings of 1,816,320,000 kWh; net annual natural gas savings of 73,040,000 therms. • Arizona: 22% cumulative electricity savings by 2020; 6% cumulative gas savings by 2020. • Arkansas: 0.75% of 2010 electric sales reduction by 2013; 0.4% of 2010 gas sales reduction by 2013. • California: Varies by utility. • Colorado: Electricity sales and demand reduction of 5% of 2006 numbers by 2018 (statutory requirement); natural gas savings requirements vary by utility . • Connecticut: 4% of retail load (includes CHP and waste heat recovery). • Delaware: Electricity and peak demand savings equivalent to 15% of 2007 numbers by 2015; natural gas savings equivalent to 10% of 2007 natural gas consumption by 2015. • Florida: 7,842 GWh cumulative reductions from 2010-2019 (statewide goal); 3,024 MW cumulative summer peak demand reduction from 2010-2019, 1,937 MW, cumulative winter peak demand reduction from 2010-2019 (statewide goal). • Hawaii: 4,300 GWh reduction in electricity use by 2030. • Illinois: 2.0% reduction of 2008 electricity sales by 2015; 1.1% reduction of 2008 peak load demand by 2018; 8.6% cumulative natural gas savings by 2020. • Indiana: 2.0% electricity sales reduction by 2019. Note: For more details on EERS policies, see www.dsireusa.org and www.aceee.org/topics/eers.