Download
1 / 42
420 likes | 652 Views
EO1Onboard Cloud Cover Detection Validation Preliminary Report. March 11, 2003 PI: Dan Mandl/Code 584 Co I: Jerry Miller/Code 586. Team Members. PI: Dan Mandl/GSFC Code 584 Co-I Jerry Miller/GSFC Code 586 Team Members: Hsiao-hua Burke/MIT-LL Michael Griffin/MIT-LL

E N D
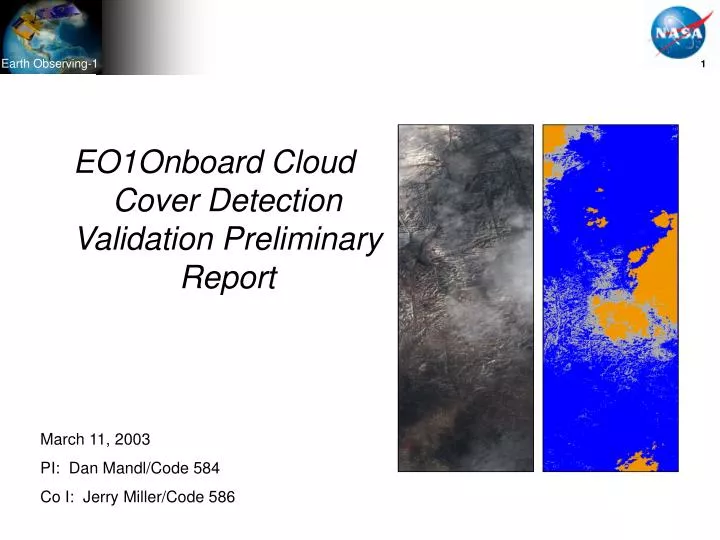
EO1Onboard Cloud Cover Detection Validation Preliminary Report March 11, 2003 PI: Dan Mandl/Code 584 Co I: Jerry Miller/Code 586
Team Members PI: Dan Mandl/GSFC Code 584 Co-I Jerry Miller/GSFC Code 586 Team Members: Hsiao-hua Burke/MIT-LL Michael Griffin/MIT-LL Stuart Frye/GSFC-Mitretek Seth Shulman/GSFC-Honeywell Robert Bote/GSFC-Honeywell Joe Howard/GSFC-Honeywell Jerry Hengemihle/GSFC-Microtel Bruce Trout/GSFC-Microtel Scott Walling/GSFC-Microtel Carolyn Upshaw/MIT-LL Kris Ferrar/MIT-LL Lawrence Ong/GSFC-SSAI Larry Alexander/GSFC-Compaq Nick Hengemihle/GSFC-Microtel
Agenda • Introduction – Dan Mandl & Jerry Miller • Requirements – Dan Mandl • Development Effort – Bruce Trout • Cloud Assessment Procedure – Michael Griffin • Conclusion – Jerry Miller & Dan Mandl
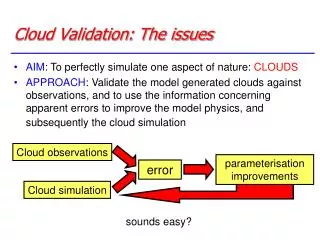
Intro: Cloud Cover Assessment Concept • Rationale: On board cloud assessment has the potential to considerably reduce the resources on downlink for unwanted scenes. • Concept: Flight validate an onboard cloud cover detection algorithm and determine the performance that is achieved on the Mongoose V • Approach: • Formulate and test a cloud cover determination algorithm that is compatible with Hyperion sensor measurements • Using MIT / LL provided algorithm, implement and test code to execute on EO-1 platform • Uplink and execute code updates onboard EO-1, and evaluate its performance on orbit • TRL In = 5 TRL Out = 6
Intro: Initial Results • Final onboard cloud cover assessment of an EO-1 8 second (.75 Gbyte) Hyperion scene was expected to take hours but instead took less than 30 minutes • Streamlined algorithm by: • Performing level 0 on all data and then selecting the needed 6 bands • Converted level 0 data to radiance (level 1R) one scan line (256 pixels) at a time • Performed pixel by pixel cloud assessment • Can perform onboard cloud assessment faster with the following capabilities: • Subsampling of raw data (can get close to same results without processing all data) • User defined area of interest within image and only process that portion • Direct access to science recorder • Cloud assessment algorithm can be expanded since we had more margin than expected • For 20 test cases on ground, performed cloud assessment within 5% for major test cases
Intro: Spacecraft • Two primary Science Instruments • Advanced Land Imager • 10m resolution • Visible imager • Questionable if can access data onboard due to onboard format • Hyperion • 30m resolution • Hyper spectral imager (220 bands) • Data access onboard for cloud detection • Orbit • 705 km Altitude • ~15 day Repeat track • 98.7 degree inclination
Intro: EO-1 Extended Mission Testbed Activities Operational Testbed Autonomous Coordination End-to-End Communications Onboard Processing Autonomous Science Experiment(ASE) • Migration of ST6 onto EO-1 $ TBS Onboard Cloud Cover Detection Validation $180K 1 Preliminary EO-1 Autonomy Experiment • Onboard planning • Onboard feature detection • Dynamic SW Bus $720K 2 EO-1, Terra, Aqua Sensorweb Demo • Uses MODIS inst center to detect volcanoes • Uses ASE to coord image collect autonomously no additional funding needed 5 Sensorweb Simulator • Related activity but not spawned by EO-1 • M. Seablom $200K Smart Antenna • Ground phased array • Cell tower com to sat AIST ESTO NRA Proposal 6 EO-1/ Gnd Sensor Sensorweb • Sensors in Huntington Botanical Garden trigger EO-1 image no additional funding needed Hyperspectral Compression WG • Onboard data mining • Onboard intelligent image compression • Working group Dynamic Resource Management • Autonomous scheduling of Ground Station by satellite AIST ESTO NRA Proposal 4 3 Intelligent Distributed Spacecraft Technology Testbed: NMP (JPL) Related activity Funded by ESTO Funded by NMP Proposed activity Note: Numbered boxes are detailed in following slides.
Intro: EO-1 Onboard Cloud Cover Detection With Onboard Replanning Funded by ESTO 1 Funded by NMP If Score < N Proposed to AIST ESTO NRA 3 2 Yes No Message GS to cancel old downlink and schedule new contact & receive confirmation Calculate cloud score onboard (L0, L1 + cloud alg) Replan alternate image onboard and reschedule S/C activities to accomplish new image Downlink as planned to 1st GS Take Image Screen for clouds onboard
Intro: Related Ongoing Feature Detection Efforts Funded by NMP 2 Autonomous Change Detection • Ice formation/retreat, flooding • Atmospheric Change • Volcanic processes (Lava, mud, plume) • Autonomous Feature Identification • Volcanic cinder cones and craters • Impact craters • Sand dunes • Autonomous Discovery • Identify features which differ from the background • Downlink science products: science events, features - not raw data • Achieves 2x-100’s x data reduction!
Cloud Cover Assessment Top Level Requirements • Implement, test, and upload WARP flight software update to perform cloud cover processing on Hyperion SWIR / VNIR image files as requested • Extract pixel read out values from these files for bands designated for cloud cover assessment use. (Includes both SWIR / VNIR bands) • Perform radiometric calibration to Level • Perform cloud cover assessment and telemeter results to the ground • Provide mechanisms to control cloud cover processing and provide reporting of cloud cover processing status
Level 0 and Level 1Processing Requirements • Perform playback of requested SWIR / VNIR image data files stored on WARP • Synchronize on header for 1st science data packet • Extract each spatial pixel read out value from this packet for bands designated for cloud cover assessment use • VNIR bands - 0.55 (band 20), 0.66 (band 31), 0.86 (band 51) • SWIR bands – 1.25 (band 110), 1.38 (band 123), 1.65 (band 150) • Read out value extraction involves stripping 12 least significant bits of 2 byte value • Apply level 1 calibration to each level 0 data sample
Cloud Cover Detection Requirements • Perform pixel by pixel testing using reflectance data to determine which pixels are cloud covered. • Cloud coverage for a given pixel will be determined based on results of a series of tests as described in the MIT presentation. Types of tests will include: • Reflectance Threshold tests. Tests reflectance value for a given spectral pixel relative to a predefined threshold. • Ratio test. Tests ratio of reflectance values for 2 different bands for a given pixel relative to a predefined threshold. • Normalized Difference Snow Index (NDSI) test. Tests differences of 2 bands divided by sum of the 2 bands relative to a predefined threshold value. • Combo test. Uses results of NDSI and Reflectance threshold tests. • Statistics to be provided which provide total tested and cloudy pixels, and percentage cloudy.
Dev Effort – SW Environment • Two Mongoose 5 (M5) Processors: • C&DH, WARP • 12MHz, ~6 MIPS, 256 MB RAM on each M5 • Both M5’s running VxWorks 5.3.1 • WARP M5 unused except for collection, S-band downlink events • WARP M5 has access to spacecraft bus for telemetry, commanding
Dev Effort: EO-1 Data Architecture GPS SENSORS ACTUATORS ACDS ACE RSN 2 Mbps COMM RSN C&DH M5 PROCESSOR H/K RSN S-BAND XPNDR 1773 BUS WARP M5 PROCESSOR 2 Mbps K2 bus MEMORY Hyperion SWIR X-BAND DATA 105 mbps D M A D M A MEMORY CONTROLLER VNIR WARP
Memory Dwell Task (MD) Checksum Task (CS) Software Manager Task (SM) 1773 RT Task (RT) Health& Safety Task (HS) MSSP I/F Task (MP) PM I/F Task (PM) Recorder Management Task (RM) 1773 RT Driver MSSP Driver PM Driver Dev Effort: Existing WARP FSW Architecture Memory Scrub Task (MS) Software Bus (SB) VxWorks / Tornado (OS) Interrupt-Driven Device Driver Newly Developed Task for EO-1 WARP Re-Used Task from MIDEX/MAP
Dev Effort: Cloud Cover Patch Concept • Will run as part of memory dwell, when not dwelling MD currently does • nothing except wait for messages on the software bus • Memory Dwell is lowest priority task except idle. • S-Band playback control flow messages will be re-routed to and • from the MP task to the MD task by patching the software • bus routing tables. • CC Code will run whenever data ready message is sent from RM • MD will utilize all spare CPU in system • Health and safety CPU hogging check will be patched out with NOPs
Dev Effort: Cloud Cover Detection Software Memory Usage • Cloud cover SW patches fit between tasks (Gaps ~100kBytes)
Dev Effort: SW Test Approach • Algorithms were integrated and tested first on a PC based simulation system using files for input test data - 9/02 • Patch test – 8/02 • Prove that we can patch the WARP Mongoose V without a full fidelity test bed • Patched No-op • Level 0 bandstripping test – 11/02, 12/02 and 1/03 • Test of full kernel load needed for later loading of CASPER • Test capture of playback data from WARP to Mongoose • Test level 0 bandstripping of data • Level 1 and onboard cloud assessment 3/10/03 • Test conversion to level 1 • Test cloud algorithm • Measure performance
Dev Effort: Development Challenges • WARP test bed limitations • WARP Wide Band Recorder and associated interfaces do not exist • WARP M5 Available Memory limited to 32 Mbytes versus the onboard memory which has 256 Mbytes • Revised load process and checksum process
Cloud Cover Estimation Procedure • From calibrated Hyperion radiance data, convert to top-of atmosphere (TOA) reflectance and estimate on a pixel-by-pixel basis the extent of cloud cover in a scene. • Convert radiance data to TOA reflectance Use pre-computed band solar flux values, earth-sun distance ratio, and the solar zenith angle • Process each frame (or line) of data Determine which pixels are cloud-covered Distinguish land, water, snow or ice from clouds • Produce cloud cover statistics for the scene
1. Radiance to TOA Reflectance- Procedure - • Obtain calibrated level 1B radiance data • Large part of cloud cover effort is focused on this task • 1 frame (256 samples by 6 bands) at a time • Obtain from telemetry or other means for the Hyperion scene • Earth-sun distance ratio de-s • Cosine of the solar zenith angle m0 • Band Solar Flux values S0,i • For each band i use the following formula to convert the calibrated Hyperion radiance Li to reflectance ri • Final product is one TOA reflectance value for each band at each pixel • r(256,6) for a single Hyperion frame
2. Cloud Cover Algorithm- Basic Tests - • The cloud cover algorithm uses only 6 bands of Hyperion data • 0.56, 0.66, 0.86, 1.25, 1.38, 1.65 mm 0.56 mm : used w/ 1.65 mm to compute the snow index 0.66 mm : basic cloud reflectance test channel 0.86 mm : used w/ 0.66 mm in NDVI-like ratio test 1.25 mm : desert/sand discrimination 1.38 mm : high cloud test channel 1.65 mm : used w/ 0.56 mm to compute the snow index • On-board processing limitations requires small number of bands • Each test utilizes TOA reflectance data • 20 Hyperion scenes of varying surface and cloud features were used to define test thresholds
Spectral Band Locations With Sample Reflectance Curves Bands 1 2 3 4 5 6
Start rT1 – rT4 are reflectance thresholds T5 – T8 are index thresholds Cloud Cover Detection Algorithm 6 channels used 0.56, 0.66, 0.86, 1.25, 1.38, 1.65 mm 1 1a 1b Y Y Y High/Mid Cloud N N N 2 Vegetation Bare Land Water N 7 Y Y N 3 N Low/Mid Cloud Vegetation Y 6 N Snow / Ice Y 4 N Y Y Desert / Sand 5b 5a N N Y NDSI: Normalized Difference Snow Index, DSI: Desert/Sand Index
Cloud Cover Algorithm- NIR Absorption Band Tests - Test 1 : High/mid cloud reflectance threshold r1.38 mm > ~ 0.1 • Only high clouds are typically observed in this channel • Strong water vapor absorption masks most low level/surface features • Under dry conditions, surface features such as ice and snow can be observed and mistaken for clouds • Further vegetation and snow/ice discrimination tests are necessary to isolate clouds Cheyenne Wyoming Cloud-free, Low/Mid cloud, Mid/High cloud To Test 2
2. Cloud Cover Algorithm- Visible Reflectance Test - To Test 3 Test 2 : Red channel reflectance threshold r0.66 mm > ~ 0.3 • Assumes low reflectance of most vegetation, soil and water surfaces in the red region of the spectrum • Snow, Ice, bright desert/sand surfaces and clouds should pass this test Kokee Hawaii Cloud-free Low/Mid cloud
2. Cloud Cover Algorithm- Visible/NIR Ratio Test - To Test 4 Test 3 : VIS/NIR ratio test r0.66 mm / r0.86 mm > ~ 0.7 • Discriminates vegetative surfaces whose reflectance varies strongly from Visible to NIR • Vegetative and soil surfaces exhibit small ratio values. • Clouds, desert/sand, snow and ice surfaces have high ratio values Kokee Hawaii Cloud-free Low/Mid cloud
2. Cloud Cover Algorithm- Bright Desert/Sand - To Test 5 Test 4 : Desert Sand Index (DSI) • Discriminates bright soil and sand surfaces whose reflectance increases slightly from 1.25 to 1.65 mm • Clouds, snow and ice reflectance tends to decrease over this range Suez Canal Cloud-free
Cloud Cover Algorithm- SWIR Snow/ice/cloud Test - To Test 6 Test 5 : Normalized Difference Snow Index (NDSI) • Some sparse or shadowed snow (in mountains) can pass test • Cloud-free snow generally displays NDSI > 0.4 Sullivan Bay Cloud-free Low/Mid cloud
Cloud Cover Algorithm- SWIR Reflectance Tests - SWIR Reflectance Tests • Test 6 r1.25 mm > ~ 0.35 • Test 7 r1.38 mm < ~ 0.1 • Eliminates most snow/ice • Low/Mid clouds should pass tests Bering Sea Cloud-free Low/Mid cloud
Cloud Cover Algorithm- Test Case Results - • The following slides show results from the cloud cover algorithm for a selection of Hyperion scenes • One or two segments (1000 lines each) of the overall Hyperion scene are displayed • Cloud cover estimates (percent of displayed scene covered by all clouds) is shown at the bottom • Examples are meant to highlight successes and failures of algorithm Colors Cloud-free Low/Mid cloud Mid/High cloud
Kokee Hawaii Lines 1700 - 2700 Lines 3200 - 4200 Total Cloud: 6.8 % Total Cloud: 41.3 %
Cheyenne Wyoming Lines 500 - 1500 Lines 2000 - 3000 Total Cloud: 27.0 % Total Cloud: 58.9 %
Kansas City Lines 0 - 1000 Lines 2100 - 3100 Total Cloud: 18.6 % Total Cloud: 72.6 %
Chiefs Island Lake Pontchartrain Total Cloud: 48.6 % Total Cloud: 68.9 %
Bering Sea Larsen Ice Shelf Total Cloud: 0.0 % Total Cloud: 0.7 %
Suez Canal Chernobyl Total Cloud: 0.0 % Total Cloud: 0.3 %
Summary of Cloud Cover Algorithm Performance • Algorithm results are encouraging • On-board cloud cover detection accuracy requirements are not stringent (10-15 %) • Only need to know if scene is clear enough for user • Simple algorithms with limited # of bands sufficient • Algorithm does a good job not classifying bright surface features (snow, ice, sand) as clouds • Difficulties with dark snow and dark/shadowed features • Adjustment of thresholds (e.g., geographical, seasonal) may improve results • Areas for future enhancements/improvements • More sophisticated algorithms • More bands • More precise validation of actual cloud cover Schedule calls for first on-board test in December 2002
Conclusion • Discovered many methods to streamline onboard cloud assessment • Big driver to onboard cloud assessment is precision required • For many applications, accuracy within a 5% is adequate thereby allowing shortcuts