Download
1 / 27
280 likes | 497 Views
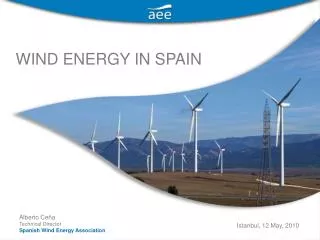
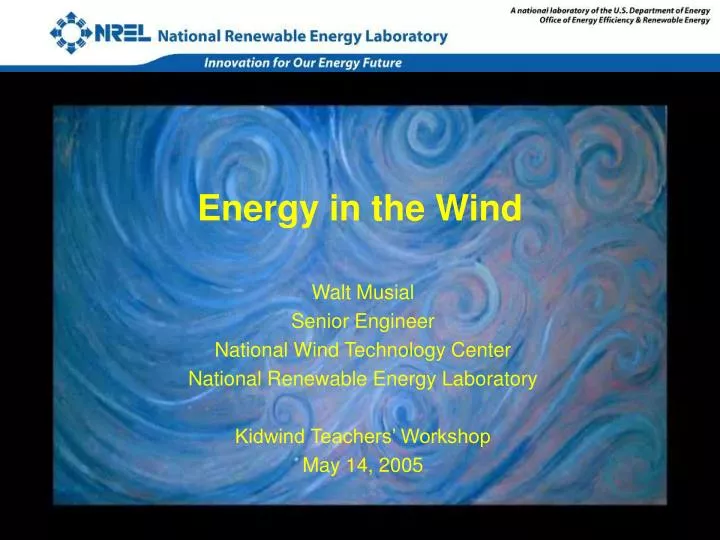
Energy in the Wind. Walt Musial Senior Engineer National Wind Technology Center National Renewable Energy Laboratory Kidwind Teachers’ Workshop May 14, 2005. Wind Energy Technology.

E N D
Energy in the Wind Walt Musial Senior Engineer National Wind Technology Center National Renewable Energy Laboratory Kidwind Teachers’ Workshop May 14, 2005
Wind Energy Technology At it’s simplest, the wind turns the turbine’s blades, which spin a shaft connected to a generator that makes electricity. Large turbines can be grouped together to form a wind power plant, which feeds power to the electrical transmission system.
Turbine Power Limited By • Power in the wind • Betz limit (air can not be slowed to zero) • Low speed losses - wake rotation • Drag losses – aerodynamics and blade geometry • Generator and drivetrain inefficiencies
Energy Power Quantity Rate Unit kWh kW, MW* Water analogy Gallons Gal / Min Car analogy- - How far? - Gallon of gas Engine HP Cost example 12 ¢/kWh $1,500,000/MW Grid Consumption & production Installed capacity The Difference Between Energy and Power
Review of Power and Energy Relationships Force = mass x acceleration F = ma Typical Units – Pounds, Newtons Energy = Work (W) = Force (F) x Distance (d) Typical units - kilowatt hours, Joules, BTU Power = P = W / time (t) Typical units kilowatts, Watts , Horsepower Power = Torque (Q) x Rotational Speed (Ω)
Kinetic Energy in the Wind Kinetic Energy = Work = ½mV2 Where: M= mass of moving object V = velocity of moving object What is the mass of moving air? = density (ρ) x volume (Area x distance) = ρ x A x d = (kg/m3) (m2) (m) = kg A V d
Power in the Wind Power = Work / t = Kinetic Energy / t = ½mV2 / t = ½(ρAd)V2/t = ½ρAV2(d/t) = ½ρAV3 d/t = V Power in the Wind = ½ρAV3
A couple things to remember… Power in the Wind = ½ρAV3 • Swept Area – A = πR2 (m2) Area of the circle swept by the rotor. • ρ = air density – in Colorado its about 1-kg/m3 R
Example – Calculating Power in the Wind Power in the Wind = ½ρAV3 V = 5 meters (m) per second (s) m/s ρ = 1.0 kg/m3 R = .2 m >>>> A = .125 m2 Power in the Wind = ½ρAV3 = (.5)(1.0)(.125)(5)3 = 7.85 Watts Units= (kg/m3)x (m2)x (m3/s3) = (kg-m)/s2 x m/s = N-m/s = Watt (kg-m)/s2 = Newton
Wind Turbine Power Power from a Wind Turbine Rotor = Cp½ρAV3 • Cp is called the power coefficient. • Cp is the percentage of power in the wind that is converted into mechanical energy. What is the maximum amount of energy that can be extracted from the wind?
Betz Limit when a = 1/3 Vax = 2/3V1 V2 = V1/3 Where Free stream velocity, V1 Wake velocity, V2=(1 2a) Velocity at rotor, Vax = V1(1-a) Induction factor, a Actuator Disk Model of a Wind Turbine Rotor Disc Rotor Wake
Reality Check • What’s the most power the .2-m turbine in the example can produce in a 5 m/s wind? 7.85 Watts x .5926 (Betz Limit) = 4.65 Watts
How big will wind turbines be? A= 12,000 m2 2005 . 1980 1985 150 m2 250 m2 1990 2000 800 m2 1995 3,700 m2 1,800 m2 2010
Analytical wind turbine models Complexity adds more limitations • Actuator Disk Theory • Momentum Theory/Wake Rotation (most common) • H. Glauret – Airscrew Theory, 1926 • Lifting Line Theory • Lifting Surface Theory • Computation Flow Models Stream tube model of flow behind rotating wind turbine blade NREL Unsteady Aerodynamics Experiment NASA Ames Wind Tunnel
Tip-Speed Ratio ΩR R Tip-speed ratio is the ratio of the speed of the rotating blade tip to the speed of the free stream wind. ΩR V = Where, Ω = rotational speed in radians /sec R = Rotor Radius V = Free Stream Velocity
Blade Planform - Solidity Blade planform is the shape of the flatwise blade surface Solidity is the ratio of total rotor planform area to total swept area Low solidity (0.10) = high speed, low torque High solidity (>0.80) = low speed, high torque R a A Solidity = 3a/A
Blade Planform TypesWhich should work the best?? Reverse Linear Taper Rectangular Linear Taper Parabolic Taper
Airfoil Nomenclaturewind turbines use the same aerodynamic principals as aircraft ΩR Ωr α V V VR = Relative Wind α = angle of attack = angle between the chord line and the direction of the relative wind, VR . VR = wind speed seen by the airfoil – vector sum of V (free stream wind) and ΩR (tip speed).
Airfoil Behavior α = low • The Lift Force is perpendicular to the direction of motion. We want to make this force BIG. • The Drag Force is parallel to the direction of motion. We want to make this force small. α = medium <10 degrees α = High Stall!!
Airfoil in stall (with flow separation) • Stall arises due to separation of flow from airfoil • Stall results in decreasing lift coefficient with increasing angle of attack • Stall behavior complicated due to blade rotation
Making Good Airfoils • Gradual curves • Sharp trailing edge • Round leading edge • Low thickness to chord ratio • Smooth surfaces Good Not so good
More Blade Geometry Terms • Twist Angle, θ– The angle of an airfoil’s chord line relative to a reference chord line (usually at the blade tip). Typical blades have about 20 degrees from root to tip. • Pitch angle, β, – The rotation angle of the whole blade measured from the plane of rotation from the tip chord line. Tip airfoil θ Root Airfoil
Energy Production Terms • Power in the Wind = 1/2AV3 • Betz Limit - 59% Max • Power Coefficient - Cp • Rated Power – Maximum power generator can produce. • Capacity factor • Actual energy/maximum energy • Cut-in wind speed where energy production begins • Cut-out wind speed where energy production ends. Typical Power Curve
Performance Over Range of Tip Speed Ratios • Power Coefficient Varies with Tip Speed Ratio • Characterized by Cp vs Tip Speed Ratio Curve
Considerations for Optimum Blade • Optimum blade will have low solidity (10%) and tip speed ratio, λ, about 5-7. (match speed to generator) • High λ means lower pitch angle (blade tip is flat to the plane of rotation). • Lower λ means higher pitch angle (feathered). • Pitch angles should be equal for all blades. • Optimum blade has large chord and large twist near hub and gets thinner near the tip. • Optimum blade is only "optimum" for one tip speed ratio. • The optimum blade will have smooth streamlined airfoils.
Questions Sirocco A warm wind of the Mediterranean area, either a foehn or a hot southerly wind in advance of a low pressure area moving from the Sahara or Arabian deserts