Download
1 / 24
240 likes | 557 Views
An Outlook for the Maritime Industry Towards 2020. Future Development in Maritime Shipping. Topics. Background and Key Drivers for the Maritime Industry A Outlook Towards 2020 Current Trends. Background – Environment and Stakeholders. Norwegian fjord Geiranger Tourists expect to see

E N D
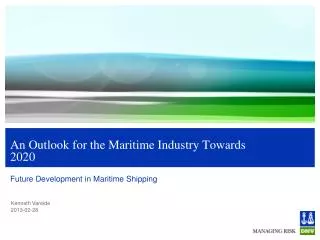
An Outlook for the Maritime Industry Towards 2020 Future Development in Maritime Shipping
Topics Background and Key Drivers for the Maritime Industry A Outlook Towards 2020 Current Trends
Background – Environment and Stakeholders Norwegian fjordGeiranger Tourists expect to see clean and unspoiled nature Restore ?
Emissions to air is governed through IMO Existing fleets Requirement 2012: SOx < 1,0% 2015: SOx < 0,1% • Compliance option • HFO + scrubber • Distillate fuels • LNG Newbuilds Requirement 2011: NOx Tier 2 2016: NOx Tier 3 • Compliance option • Scrubber + SCR • LNG, NOx abatement
Megatrends and External Drivers for the Maritime Industry • FUEL TRENDS • Sustained high fuel prices? • LNG cheaper than HFO? • Development of LNG infrastructure • Impact of sulphur regulations • REGULATORY AND STAKEHOLDER PRESSURE • Global or local regulations? • Further requirements on GHG emissions? • Rating schemes and requirements from charterer and public • ECONOMIC GROWTH AND DEMAND FOR TRANSPORT • Boom or bust? • Growth level and level of contracting • Overcapacity of vessels?
“Shipping 2020” Technology investments in the new market reality
Scenarios have beencreated to captureuncertainties Methodology and assumptions
The process – the big picture Methodology and assumptions Scenario A Scenario B Scenario C Scenario D Environmental regulations Fuel trends (price, mix) World economy and demand for transport Simulation model Technology trends Investment profile and ship characteristics results
Finding 1 findings More than 1 in 10 new buildings in the next 8 years will be delivered with gas fuelled engines • LNG price, sulphur limits and EEDI are the main drivers • From 2012-2019 the LNG price is the main contributing factor • When approaching 2020, EEDI and sulphur limits will create additional motivation for LNG as fuel • In Scenario D, 35% of newbuildings will be delivered with LNG engines • In scenario D, we foresee about 1,000 newbuildings from 2012-2020 and some 6-700 retrofits Share of LNG fuelled newbuildings Scenario D
Finding 2 findings In 2020, the demand for marine distillates could be as high as 200-250 million tonnes annually • A 0.1% limit in ECAs (2015) is expected to increase the demand to 45 million tonnes • The current annual global demand for marine distillates is about 30 million tonnes • With a global sulphur limit HFO demand may drop from 300-350 million tonnes to only 80-110 million tonnes in 2020 • Depends on the number of scrubbers in use • The use of LNG will not significantly impact the demand of other fuels • Energy efficiency measure will only slow the fuel demand in the short term Fuel mix in 2020
Finding 3 findings Newbuildings in 2020 will emit up to 10 to 35% less CO2 than today’s ships. The EEDI will be a driver for more than half of this reduction • Phase 0 of EEDI (2013) will encourage cost-effective measures • In Phase 1 (2015) and 2 (2020), up to half the reductions are motivated by EEDI alone • Due to short investment horizon and low fuel burden, these reductions are not cost effective for the ship owner • But in the long-term these are cost-effective • Small differences between scenarios • Fuel prices are already so high that any variation does not affect uptake • Operational measures not included CO2 emission reduction on newbuildings EEDI reduction on newbuildings
Finding 4 findings Scrubbers are a significant option after 2020 • Few ships spend more than 30% of their time in and ECA justifying a scrubber before 2020 • In 2020, with the global sulphur requirements, scrubbers become a significant solution • Scrubbers can be retrofitted and can take 25% of the market, 15-20,000 ship • Still, 70% of ships will run on distillates • In the short term LNG can only take a small part of the market • Uncertainty about the 2020 limit will slow technology development and uptake Ship owner investment profile SOx reduction options in 2020
Finding 5 findings Ballast water treatment systems will be installed on at least half of the world fleet • The Ballast Water Management Convention has not yet entered into force, but • The schedule for mandatory treatment of BW is fixed (2019) • The US has decided to implement a similar scheme for all ships in US waters (2013) • Other countries have local requirements • This will motivate a significant part of the world fleet to implement a treatment system irrespective of BWMC progress Annual expected ballast water treatment installations
Finding 6 findings At least 30-40% of newbuildings will be fitted with EGR or SCR by 2016 • Both EGR and SCR are currently under development and need more time to mature • LNG is an alternative but does not seem to replace more than 25% of EGR or SCR installations • Dependent on LNG price • Will a ship owner will opt for a Tier III engine even if the ship is initially not planned for sailing in an ECA? • Lower second-hand value due to the loss of geographic flexibility NOx treatment installations
LNG Vessels in Operation as of Today 2020: ? 2015 63 ? ? ? ? 2013: 37 2020 18
2020: • 1000 Looking Ahead for 2013 and Beyond 2014: 63 2020 19
Some vessels in Operation on LNG Fuel. Total 31 Ferries (3) • Capacity: 600 pax • Engine: Mitsubishi • Ferries (12) • Capacity: 587 pax / 212 cars • Engine: Rolls Royce, Bergen KV-GE Patrol Boats (3) • Engine: Mitsubishi Offshore Supply Vessels (7) • Engine: Wartsila Dual Fuel
Some Vessels on Order: Total 38 2 Cruise RoPax Ferries • Main Engine: Rolls Royce • Capacity: 3500 Pax / 306 cabins 1 Fish Farm Product Vessel Engine: Rolls Royce Dwt: 2650 tonnes • Ro RoContainers (2) • Capacity: 94 TEU • Engine: Rolls Royce • High Speed Light Craft, 50 knots (1) • Capacity: 1000 Pax • Engine: GE Gas Turbine • Tug (1) • Engine: Rolls Royce • Bollard Pull: 65 tonnes
…with visions and technologies:DNV extraordinary innovation projects ECORE, Ore Carrier Lloyd’s List Global Award, 2011. OSHIMA ECO 2020
Further Considerations for LNG as a fuel Ilustration by IM Skaugen • Safety • Security • Local state and public awareness • Supply • Refueling methods • Economy: • Ship • Port • Provider of LNG • The LNG market
Developing LNG Bunkering Infrastructure Small scale LNG infrastructure can be set up in a number of ways: • Coastal Shore Storage Permanent or Mobile ISO tanks • Replenishment by trucks, rail or feeder vessels • By trucking or small LNG carriers (up to 200m3) • Subject to weather and terrain. Limitations > 200 miles is questionable. • DOT driver regulation: 11 hrs / day & 70 hrs per week. • Issues concerning confidence on supply. • By small scale liquefaction plants with a natural gas pipeline grid in the vicinity • Permitting is needed
Safeguarding life, property and the environment www.dnv.com