Download
1 / 1
10 likes | 85 Views
A Long Term Data Record of the Ozone Vertical Distribution: 1970-2010 IN21A – 1402 by Richard McPeters 1 , Dave Haffner 2 , Steve Taylor 2 , and P.K. Bhartia 1 NASA GSFC, and 2) Science Systems Applications Inc. Conclusions a coherent 40 year time series of ozone

E N D
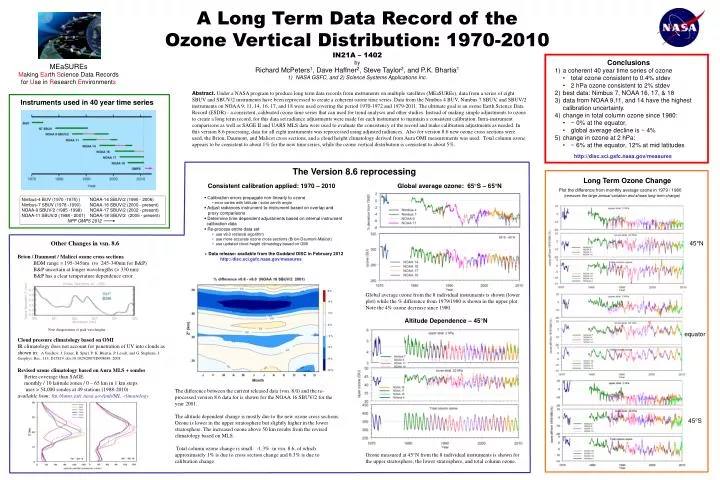
A Long Term Data Record of the • Ozone Vertical Distribution: 1970-2010 • IN21A – 1402 • by • Richard McPeters1, Dave Haffner2, Steve Taylor2, and P.K. Bhartia1 • NASA GSFC, and 2) Science Systems Applications Inc. • Conclusions • a coherent 40 year time series of ozone • total ozone consistent to 0.4% stdev • 2 hPa ozone consistent to 2% stdev • best data: Nimbus 7, NOAA 16, 17, & 18 • data from NOAA 9,11, and 14 have the highest calibration uncertainty. • change in total column ozone since 1980: • ~ 0% at the equator, • global average decline is ~ 4% • change in ozone at 2 hPa: • ~ 6% at the equator, 12% at mid latitudes MEaSUREs Making Earth Science Data Records for Use in Research Environments Abstract.Under a NASA program to produce long term data records from instruments on multiple satellites (MEaSUREs), data from a series of eight SBUV and SBUV/2 instruments have been reprocessed to create a coherent ozone time series. Data from the Nimbus 4 BUV, Nimbus 7 SBUV, and SBUV/2 instruments on NOAA 9, 11, 14, 16, 17, and 18 were used covering the period 1970-1972 and 1979-2011. The ultimate goal is an ozone Earth Science Data Record (ESDR) - a consistent, calibrated ozone time series that can used for trend analyses and other studies. Instead of making simple adjustments to ozone to create a long term record, for this data set radiance adjustments were made for each instrument to maintain a consistent calibration. Intra-instrument comparisons as well as SAGE II and UARS MLS data were used to evaluate the consistency of the record and make calibration adjustments as needed. In this version 8.6 processing, data for all eight instruments was reprocessed using adjusted radiances. Also for version 8.6 new ozone cross sections were used, the Brion, Daumont, and Malicet cross sections, and a cloud height climatology derived from Aura OMI measurements was used. Total column ozone appears to be consistent to about 1% for the new time series, while the ozone vertical distribution is consistent to about 5%. Instruments used in 40 year time series http://disc.sci.gsfc.nasa.gov/measures The Version 8.6 reprocessing Long Term Ozone Change • Consistent calibration applied: 1970 – 2010 • Calibration errors propagate non-linearly to ozone • error varies with latitude / solar zenith angle • Adjust radiances instrument-to-instrument based on overlap and • proxy comparisons • Determine time dependent adjustments based on internal instrument • calibration data • Re-process entire data set • use v8.0 retrieval algorithm • use more accurate ozone cross sections (Brion-Daumont-Malicet) • use updated cloud height climatology based on OMI • Data release: available from the Goddard DISC in February 2012 http://disc.sci.gsfc.nasa.gov/measures Global average ozone: 65°S – 65°N Plot the difference from monthly average ozone in 1979 / 1980 (removes the large annual variation and shows long term change) Nimbus-4 BUV (1970 -1975) ) NOAA-14 SBUV/2 (1995 - 2006) Nimbus-7 SBUV (1978 -1990) NOAA-16 SBUV/2 (2000 - present) NOAA-9 SBUV/2 (1985 -1998) NOAA-17 SBUV/2 (2002 - present) NOAA-11 SBUV/2 (1988 - 2001) NOAA-18 SBUV/2 (2005 - present) NPP OMPS 2012 Other Changes in vsn. 8.6 Brion / Daumont / Malicet ozone cross sections BDM range = 195-345nm (vs 245-340nm for B&P) B&P uncertain at longer wavelengths (> 330 nm) B&P has a clear temperature dependence error Cloud pressure climatology based on OMI IR climatology does not account for penetration of UV into clouds as shown in: A Vasilkov, J. Joiner, R. Spurr, P. K. Bhartia, P. Levelt, and G. Stephens, J. Geophys. Res., 113, D15S19, doi:10.1029/2007JD008689, 2008 Revised ozone climatology based on Aura MLS + sondes Better coverage than SAGE monthly / 10 latitude zones / 0 – 65 km in 1 km steps uses > 54,000 sondes at 49 stations (1988-2010) available from: ftp://toms.gsfc.nasa.gov/pub/ML_climatology 45°N Global average ozone from the 8 individual instruments is shown (lower plot) while the % difference from 1979/1980 is shown in the upper plot. Note the 4% ozone decrease since 1980. Altitude Dependence – 45°N Note disagreement of peak wavelengths. equator The difference between the current released data (vsn. 8.0) and the re-processed version 8.6 data for is shown for the NOAA 16 SBUV/2 for the year 2001. The altitude dependent change is mostly due to the new ozone cross sections. Ozone is lower in the upper stratosphere but slightly higher in the lower stratosphere. The increased ozone above 50 km results from the revised climatology based on MLS. Total column ozone change is small: -1.3% in vsn. 8.6, of which approximately 1% is due to cross section change and 0.3% is due to calibration change. 45°S Ozone measured at 45°N from the 8 individual instruments is shown for the upper stratosphere, the lower stratosphere, and total column ozone.