Download

1 / 17
180 likes | 203 Views
Control Structure Design for an Activated Sludge Process. Michela Mulas 1,2 , Sigurd Skogestad 2. 1 Dipartimento di Ingegneria Chimica e Materiali Università degli Studi di Cagliari, Italy. 2 Chemical Engineering Department NTNU, Trondheim, Norway. Outline. Outline. Motivations

E N D
Control Structure Design for an Activated Sludge Process Michela Mulas1,2, Sigurd Skogestad2 1 Dipartimento di Ingegneria Chimica e Materiali Università degli Studi di Cagliari, Italy 2 Chemical Engineering Department NTNU, Trondheim, Norway
Outline Outline • Motivations • Plant Description • Process Model • Control Structure Analysis • Results • Conclusions
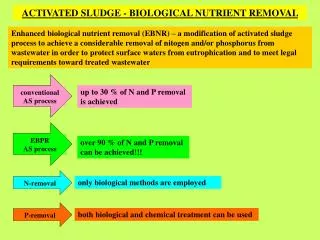
More efficient procedures for WWTP management and control Motivations Wastewater treatment processes (WWTP) can be considered the largest industry in terms of volumes of raw material treated Outline Motivations Industrial expansion and urban population growth have increased the amount and diversity of wastewater generated Because of the most recent guidelines and regulation which require the achievement of specific standards to the treated wastewater, a great effort has been devoted to the improvement of treatment processes The WWTP has become part of a production process, e.g. for fresh water reuse purpose
Objectives WWTP are generally operated with only elementary control systems Outline Motivations Objectives • The problems are: • the inflow is variable, in both quantity and quality • there are few and unreliable on-line analyzers • most of the data related to the process are subjective and cannot be numerically quantified With a proper control structure design we might implement the optimal operation policy for an ASP Which variables should be measured, which inputs should be manipulated and which link should be made between the two sets?
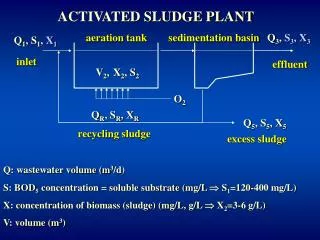
Plant Description The Control Structure Analysis is applied to a real plant, the TecnoCasic wastewater plant, located near Cagliari (Italy) Outline Motivations Objectives Plant Description The Activated Sludge Process (ASP) is the most widely used system for biological treatment of liquid waste ASP involves a biological reactor and a settler where from the biomass is recycled to the anoxic basin Nitrogen Removal
Denitrification - NO 3 O N + 3 2 2 Nitrification + - + NH 2 O NO 2 H H O + + + 4 2 3 2 Process Model Bioreactor The Activated Sludge Model No.1 (Henze et al.,1987) is the state of art model when the biological phosphorus removal is not considered • Outline • Motivations • Objectives • Plant Description • Process Model • Bioreactor • ASM No 1 soluble 13 State Variables 13 State Variables particulate 8 Reaction Rates 8 Reaction Rates 19 Stoichiometric and Kinetic Coefficients 19 Stoichiometric and Kinetic Coefficients 19 Stoichiometric and Kinetic Coefficients Aerobic Zone Anoxic Zone Dissolved Oxygen (DO) Control
Clarification Thickening Ref. Takács et al., 1997 Process Model Secondary Settler Effluent • Outline • Motivations • Objectives • Plant Description • Process Model • Bioreactor • Secondary Settler • Takács Layered • Model WAS RAS When entering the settler, all the particulate components in the ASM1 model are lumped into a single variable X. The reverse process is performed as for the outlet The settler is modelled as a stack of layers. The concentration within each layer is assumed to be constant No biological reactions occur Takács Model
Matlab/ Simulink Process Model A representation of the TecnoCasic plant can be implemented in several different ways, using different software and simulators Outline Motivations Objectives Plant Description Process Model
Simulink Exp Data Test Motion TecnoCasic Plant Data • Outline • Motivations • Objectives • Plant Description • Process Model • Bioreactor • Secondary Settler • Test Motion Off-Line measurements: • Chemical Oxygen Demand (COD) • Nitrogen • Sludge Volume Index (SVI) available every two or three days On-Line measurements: • Flow rates • DO concentration in the basin • Temperatures
Bottom-Up Design Top-Down Design Control Structure Analysis Find candidate controlled variables with good self-optimizing properties • Outline • Motivations • Objectives • Plant Description • Process Model • Bioreactor • Secondary Settler • Test Motion • Top-Down Analysis Self-Optimizing Control is when acceptable operation can be achieved using constant setpoints for the controlled variables The procedure proposed by Skogestad (2004) is divided in two main part: • Define operational objectives • Identify degrees of freedom • Identify primary controlled variables • Determine where to set the production rate
DeNitr Nitr J Q Q Q = = + air air air “Top-Down” Analysis Step 1 “Identify operational constraints and preferably a scalar cost function to be minimized” • Outline • Motivations • Objectives • Plant Description • Process Model • Bioreactor • Secondary Settler • Test Motion • Top-Down Analysis • Step 1 • Cost Function • Constraints Cost Function The energy consumption in terms of aeration power represents the major economic duty in our ASP Constraints Effluent Constraints:defined by the legislation requirement for the effluent • Operational Constraints: • DO concentration • Food-to-Microorganisms Ratio • Sludge Retention Time Disturbances The influent compositions are the disturbances which we cannot affect In the TecnoCasic plant an equalization tank is present at the top of the ASP
N N N 3 5 7 = = = m m opt N N N = - opt , free opt active N 1 = opt , free “Top-Down” Analysis Step 2 “Identify dynamic and steady-state degrees of freedom (DOF)” • Outline • Motivations • Objectives • Plant Description • Process Model • Bioreactor • Secondary Settler • Test Motion • Top-Down Analysis • Step 1 • Step 2 • Degrees of Freedom Dynamic or Control DOF Optimization DOF The optimization is generally subject to constraints and at the optimum many of these are usually “actives”, e.g. in the ASP the DO concentrations in both anoxic and aerated zone
( ) ( ) = - L J WAS , d J d WAS WAS opt “Top-Down” Analysis Step 3 “Which (primary) variable should we control?” • Outline • Motivations • Objectives • Plant Description • Process Model • Bioreactor • Secondary Settler • Test Motion • Top-Down Analysis • Step 1 • Step 2 • Step 3 • Controlled • Variables We first need to control the variables directly related to ensuring optimal economical operation The optimisation of a system is selecting conditions to achieve the best possible result with some limits: we are interested in steady state optimization of the ASP in the TecnoCasic plant The magnitude of the loss will depend on the control strategy used to adjust the WAS flowrate during operation Open-Loop Strategies: we want to keep the WAS flowrate at its setpoint Closed-Loop Strategies: we adjust WAS in a feedback fashion in an attempt to keep the controlled variable at its setpoint
Closed Loop Open Loop “Top-Down” Analysis Step 3 “Which (primary) variable should we control?” • Outline • Motivations • Objectives • Plant Description • Process Model • Bioreactor • Secondary Settler • Test Motion • Top-Down Analysis • Step 1 • Step 2 • Step 3 • Controlled • Variables To identify good candidate controlled variables, one should look for variables that satisfy all of the following requirements (Skogestad, 2000): • The optimal value of should be insensitive to disturbance • The controlled variable should be easy to measure and control • The controlled variable should be sensitive to changes in the manipulated variables (the steady degree of freedom).
Results • Outline • Motivations • Objectives • Plant Description • Process Model • Bioreactor • Secondary Settler • Test Motion • Top-Down Analysis • Step 1 • Step 2 • Step 3 • Results The cost function J goes down as the waste flowrate increases
Results • Outline • Motivations • Objectives • Plant Description • Process Model • Bioreactor • Secondary Settler • Test Motion • Top-Down Analysis • Step 1 • Step 2 • Step 3 • Results The anoxic zone behaviour can influence the overall cost function; even if the air flowrate in it is quite small compared with the aerobic part
Conclusions In this work we have considered alternative controlled variables for the TecnoCasic activated sludge process • Outline • Motivations • Objectives • Plant Description • Process Model • Bioreactor • Secondary Settler • Test Motion • Top-Down Analysis • Step 1 • Step 2 • Step 3 • Results • Conclusions Following the plantwide control structure design procedure proposed by Skogestad (2004), we have found that a better response to influent disturbances can be obtained using as controlled variable the total Nitrogen in the anoxic zone, manipulating the WAS flowrate That is a good starting point to understand how this kind of system can be improve Theoptimization part has to be implemented and studied for systems with a different configuration For an activated sludge plant the only steady state occurs when the process is shut down (Olsson and Newell, 2001). For that reason it will be interesting to find a kind of “dynamic” steady state and apply the top-down analysis in this case