Download
1 / 32
320 likes | 552 Views
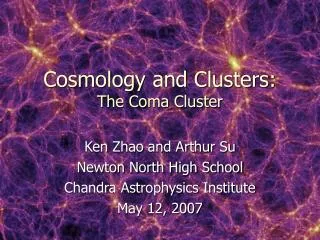
The Coma cluster magnetic field. preliminary results from Faraday Rotation measures. Annalisa Bonafede PhD student at IRA Radio Astronomy Institute Bologna (Italy). With: L. Feretti M. Murgia, F. Govoni, G. Giovannini, D. Dallacasa, K. Dolag, G. B .Taylor.

E N D
The Coma cluster magnetic field preliminary results from Faraday Rotation measures Annalisa Bonafede PhD student at IRA Radio Astronomy Institute Bologna (Italy) With: L. Feretti M. Murgia, F. Govoni, G. Giovannini, D. Dallacasa, K. Dolag, G. B .Taylor Image courtesy of NRAO/AUI and Neal Miller, Jansky Fellow of the NRAO
OUTLINE • Magnetic Field in Galaxy Clusters • How to study Cluster Magnetic fields • The Coma Cluster magnetic Field: Previous Works • The Coma Cluster: New Radio Data • The Coma Cluster: Magnetic Field Simulations • Preliminary Results & Previous Estimates
Galaxy Clusters: Galaxies(~5% Mtot)+ DarkMatter(~80% Mtot)+ Intra Cluster Medium(~15% Mtot) ICM: Thermal component Hot gas (T 107-8 ° K) Optically thin Bremsstrahlung emission [Soft X] Abell 2163 Feretti et al. (2001) Govoni et al. (2004) Radio Diffuse Emission Non thermal component magnetic field +relativistic particles Faraday Rotation measures
Cluster magnetic fields Cosmological simulations (Dolag et al., 99, 02) Seed field ~ 10-9 G at z=20 in LCDM universe Field strength ~10-6 G at z=0 (Dolag et al., 05) The final structure of the magnetic field in galaxy cluster reflects the process of structure formation simulations adiabatic
How can we study cluster magnetic field? From Radio Diffuse Emission: Magnetic field strength Equipartition estimate Beck & Krause 05 Brunetti et al. 97 • k=ratio of the energy in relativistic protons to that in electrons • V=Volume • F =Volume filling factor • L=Synchrotron Luminosity • d=Particle energy spectral index <B> 0.1 – 2 mG (see Govoni & Feretti, 2004) Volume average estimate
How can we study cluster magnetic field? From Hard-X ray emission Magnetic field strength Inverse Compton estimate <B> fraction of mG ( e.g. Fusco-Femiano et al., 2002, 2004) Instrumental resolution Assumption on the Electrons spectrum Volume average estimate
q E H E RM λ d How can we study cluster magnetic field? Faraday Rotation l=3 cm l=6 cm
ANALYTICAL APPROXIMATION: Assuming LC B// ne cost ne LC los B// 4-8 mG (e.g. Clarke et al. 2001 ) Magnetic field fluctuates over a wide range of spatial scales
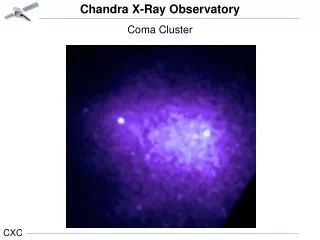
The Coma cluster z=0.023 Equipartition B ~0.7 – 1.9 µG(Thierback et al. 2003)assuming k=1 - 100, a[300Mev ]= 0.79 over ~1 Mpc3 Inverse Compton B~0.2 µG (Fusco Femiano et al. 2004)over 1.3°x 1.3°, assuming Gx [20-80 keV]=2 RM analysis of NGC4869 B ~6 µG B=(0.2±0.1) µG(Feretti et al. 1995)
Aim of the work: Constrain the magnetic field strength and structure Sample of 20 polarized sources selected 6 extended sources observed in 2006 - 2007 at 4 frequencies: 4.5 ,4.9 ,8.0 ,8.5 GHz - 8 hour/source at the VLA, B array Θ ~ 0.7’’ – 1.5’’ ~ 0.7 kpc X: RASS, data archive Radio: NVSS
Rotation Measures fits PACERMAN algorithm (Polarization Angle CorrRecting Rotation Measure ANalisys ) Dolag et al. (2005) RM in noisy regions obtained using information of high signal to noise regions RM images obtained for 5 source. 1 source low number of reliable RM pixels from 50 to 1500 kpcfrom X-ray centre sRM RM due to the cluster
EMBEDDED GALAXIES • BACKGROUND GALAXIES • CONTROL SAMPLE Clarke 2004 Radio data corona? core removed from RM images Coma:l=58°, b=88° <rm_gal> ~ 1 rad/m/m (Simard – Normandin et al 81) 5C4.127 at 3.6 cm
Rotation Measures fits NGC4874 5C4.42 5C4.127 Cluster field model where different spatial scales coexist <RM> ≠0 B on scales larger then the size of the sources NGC4869 RM fluctuations on small scales B on scale smaller then the size of the sources 5C4.152
MAGNETIC FIELD MODEL: the power spectrum FARDAY code(Murgia et al. 2004) Numerical simulations of 3-D magnetic field • Bihave a Gaussian distribution, • The magnetic fieldpower spectrum|Bk|2=Cn2k – n • The magnetic energy density scales as n<3 B small spatial scales n>3 B large spatial scales Murgia et al. (2004)
Lmin Lmax Govoni et al. (2005)
MAGNETIC FIELD MODEL: radial profile sRM – X Surface brightness correlation(Dolag et al. 99, 01) Spatial correlations between thermal and non-thermal energy density(Govoni et al. 2001)
MAGNETIC FIELD MODEL: radial profile h=1 scaling with density h=2/3 frozen –inscaling h=1/2 energy density scaling as gas energy density profile n0= 3.44 ± 0.04 10-3 cm-3 b=0.75 ±0.03 rc=290 ±15 kpc (Briel et al. 1992) “b-model” (Cavaliere & Fusco-Femiano, ’76)
B0,h, n,Lmin, Lmax Simulation of cubical box of 10243 cells, Cellsize 1 kpc Lmin = 2 kpc close to observations resolution Max allowed Lmax=512kpc RM SIMULATIONS Integration step = 1kpc
|Bk|2 ~ k – n Degeneracy betweenLmaxand n RM SIMULATIONS Degeneracy betweenB0 andh
4 Slope n 1 Lmax (kpc) 20 kpc 512 kpc PRELIMINARY RESULTS The magnetic field power spectrum The ratio is sensitive to the power spectrum slope nsee Murgia et al. 2004 Coma sources mean ratio
PRELIMINARY RESULTS The magnetic field power spectrum Lmax = 512 kpc & n= 1.85 Lmax=25 kpc & n=11/3 (Kolmogorov) 2 asimptotic trends: For 100 kpc<Lmax<400 kpcn=2 Abell 2255 (Govoni et al. 2006) n=2 4 Abell 119 (Murgia et al. 2004) n=2 CONSISTENT WITH KOLMOGOROV SPECTRUM Abell 400, Abell 2634 and Hydra A (Vogt & Ensslin 2003)
PRELIMINARY RESULTS The magnetic field radial profile Simulated magnetic field with different valuesof B0andh 2 cluster sources 3 background sources Integration from r=0 up to 5 rc(~ 1500 kpc) Integration from r= - 5rc up to 5 rc
PRELIMINARY RESULTS “failed” source position ( will be re-observed next April)
PRELIMINARY RESULTS Equipartition vs Rotation Measure estimate B0= 8 mG, h=1.5 Magnetic energy density in the centralMpc3 <B>~ 1.2mG r~620 kpc ~22 arcmin Radio Halo B ~0.7 – 1.9 µG(Thierback et al. 2003)assuming k=1 - 100, a[300Mev ]= 0.79 over ~1 Mpc3
PRELIMINARY RESULTS Inverse Compton vs Rotation Measure estimate Computed over The Same Volume.. Inverse Compton estimate Present RM estimate B0= 8 mG, h=1.5 Bepposax: PDS field of view: 1.3°x 1.3° Spherical volume of 1.3° diameter <B>~0.2 mG < B>~0.4 mG
Conclusions Faraday Rotation Measures reveal magnetic field strength and structure in the Intra Cluster Medium In the Coma cluster different magnetic field configuration are compatible with present data more sources are required to discriminate between different models! At present: best fit B0= 8 mG and h=1.5 is not in disagreement with equipartition and Inverse Compton Estimate (radial decline must be taken into account!)
To improve the work: break the power spectrum degeneracy better constrain on the radial profile and strength: The failed source will be re-observed next April But, apart from new observations ... Modeling the gas around the central Radio galaxyChandra observations: the galaxy retains the central parts of its X-ray corona (Vikhlinin et al. 2001) – only on few kpc scale – this could reduce the central field’s strength Pressure map Modeling the thermal gas profile cluster cosmological simulations Modeling the ICM turbulence power spectrum (Schuecker et al. 2004) Non-parametric fits to take the errors into account properly (Schuecker et al. 2004)
Eckert et al, 08 INTEGRAL data: excess is confirmed (Eckert et al, 2007) in the 18-30 keV band, (attributed to hotter gas (E<14 keV) in the SW region) INTEGRAL+RXTE+ROSAT data (Lutovinov et al, submitted ) No significant excess over the thermal spectrum at high energies (E>44 keV) Upper limits consistent with Bepposax detection
Cluster magnetic fields Thermal Conduction Turbulent magnetic fields - lB 0.1-0.2 Ks in static magnetc field approximation , over distances >> lB (see Chandran, 03) Radio Halo formation models Secondary models(e.g. Pfrommer & Ensslin, 04) Different magnetic fields in cluster with ad without radio halo Re-acceleration models(e.g.Cassano & Brunetti 05) Radio Halo emission due to reacceleration (similar magnetic fields in clusters)
Cluster magnetic fields Magnetic field orgin High redshift (z>4) Low redshift (z 2 -3) (e.g. Volk & Atoiyan) Seed field Cosmological (pre-recombination) (see Grasso & Ruinstein 01) Concentrated within galaxy clusters Biermann battery effect during structure formation processes ( Kulsrud et al. 97) Early population of AGN & starburst galaxies (Kronberg et al. 99) Amplification