Download
1 / 13
130 likes | 139 Views
Arctic and Antarctic Research Institute St. Petersburg www.aari.nw.ru. V.G. Smirnov Yu. A. Scherbakov V.S. Loschilov Sea Ice mapping in AARI based on various space borne data. Satellites. Visual IR microwave spectral ranges. Data from manned/unmanned

E N D
Arctic and Antarctic Research Institute St. Petersburg www.aari.nw.ru V.G. Smirnov Yu. A. Scherbakov V.S. Loschilov Sea Ice mapping in AARI based on various space borne data
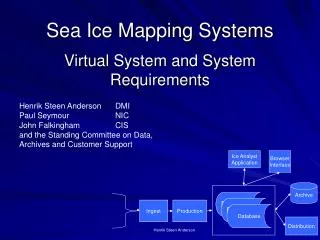
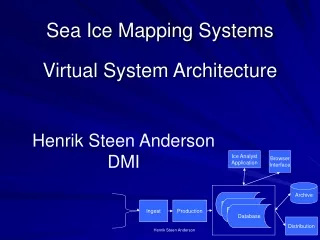
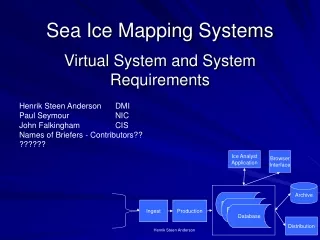
Satellites Visual IR microwave spectral ranges Data from manned/unmanned polar stations and buoys Information used for ice charts construction Analytic center Data from aircraft (including ship based helicopters) Ship based meteorological and ice observations Data base on previous ice charts, ice forecasting
Transformation and geolocation of satellite images using: a) orbital data b) coastal line a) b) NOAA, March 31, 2003
Ice information derived from Okean SLR images, 01-07.01.2000
Joint use of data received from different satellites Scaled images RADARSAT & NOAA
a) b) c) Ice chart (c) constructed with the use of RADARSAT(a) and NOAA data, April 30, 1998
Use of NOAA IR data for of ice thickness determination(original technique developed at AARI is applied) Barents Sea, April 1, 2001
Use of satellite data from modern satellites (different spectral ranges) MODIS (TERRA) SAR (RADARSAT) May 11, 2001 January 29, 2001 Barents Sea
Ice charting using international egg codes Barents Sea, April 26-30, 2002
Ice drift determination using satellite imagery Ice drift (May 11-29, 2002)
Conclusion • Satellite imagery is the main source of data on ice conditions in the Arctic, Antarctic and ice covered seas. To increase the reliability of ice information derived from satellite imagery joint processing of the data from different spectral ranges and other data sources has to be applied.