Download
1 / 1
10 likes | 167 Views
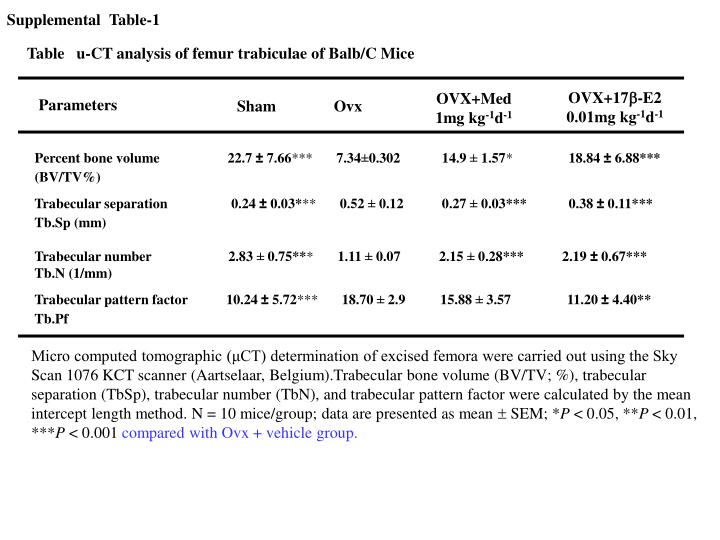
Supplemental Table-1. Table u-CT analysis of femur trabiculae of Balb/C Mice. OVX+17 - E2 0.01mg kg -1 d -1. OVX+Med 1mg kg -1 d -1. Parameters. Sham. Ovx.

E N D
Supplemental Table-1 Table u-CT analysis of femur trabiculae of Balb/C Mice OVX+17-E2 0.01mg kg-1d-1 OVX+Med 1mg kg-1d-1 Parameters Sham Ovx Percent bone volume 22.7 ± 7.66***7.34±0.302 14.9 ± 1.57* 18.84 ± 6.88*** (BV/TV%) Trabecular separation 0.24 ± 0.03***0.52 ± 0.12 0.27 ± 0.03*** 0.38 ± 0.11*** Tb.Sp (mm) Trabecular number 2.83 ± 0.75*** 1.11 ± 0.07 2.15 ± 0.28*** 2.19 ± 0.67*** Tb.N (1/mm) Trabecular pattern factor 10.24 ± 5.72***18.70 ± 2.9 15.88 ± 3.57 11.20 ± 4.40** Tb.Pf Micro computed tomographic (μCT) determination of excised femora were carried out using the Sky Scan 1076 KCT scanner (Aartselaar, Belgium).Trabecular bone volume (BV/TV; %), trabecular separation (TbSp), trabecular number (TbN), and trabecular pattern factor were calculated by the mean intercept length method. N = 10 mice/group; data are presented as mean SEM; *P < 0.05, **P < 0.01, ***P < 0.001 compared with Ovx + vehicle group.