Download
1 / 19
190 likes | 305 Views
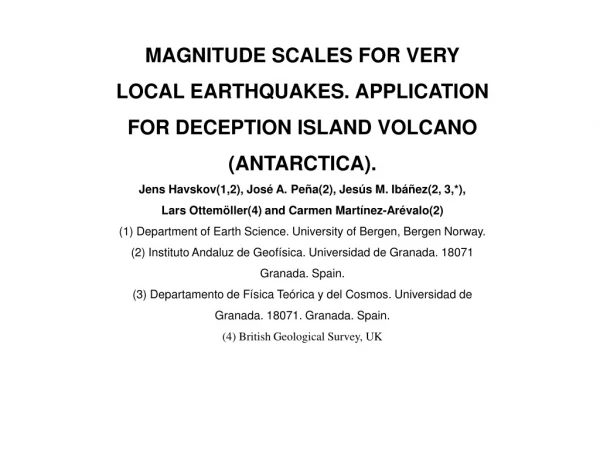
MAGNITUDE SCALES FOR VERY LOCAL EARTHQUAKES. APPLICATION FOR DECEPTION ISLAND VOLCANO (ANTARCTICA). Jens Havskov(1,2), José A. Peña(2), Jesús M. Ibáñez(2, 3,*), Lars Ottemöller(4) and Carmen Martínez-Arévalo(2) (1) Department of Earth Science. University of Bergen, Bergen Norway.

E N D
MAGNITUDE SCALES FOR VERY LOCAL EARTHQUAKES. APPLICATION FOR DECEPTION ISLAND VOLCANO (ANTARCTICA). Jens Havskov(1,2), José A. Peña(2), Jesús M. Ibáñez(2, 3,*), Lars Ottemöller(4) and Carmen Martínez-Arévalo(2) (1) Department of Earth Science. University of Bergen, Bergen Norway. (2) Instituto Andaluz de Geofísica. Universidad de Granada. 18071 Granada. Spain. (3) Departamento de Física Teórica y del Cosmos. Universidad de Granada. 18071. Granada. Spain. (4) British Geological Survey, UK
Problem: Magnitudes of very small events (M< 0) Magnitudes at very small distances (< 5 km) Automatic magnitude determination
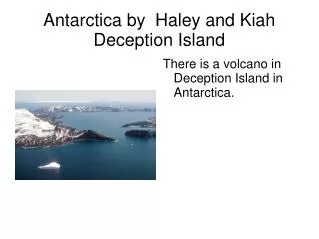
Deception Island Data selected for this study. 2 events out 153 events are outside the map.Symbols of the earthquakes indicates the focal depth of the events: dots smaller than 1 km, crosses between 1 and 3 km and squares focal depth greater than 3 km. Note that most events are very close to the array.
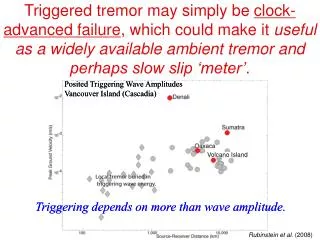
Options for magnitude: Local magintude: Well defined, include standard attenuation Moment magntude: Easy to automate, atteneuation must be known Coda magnitude: Must be calibrated, easy to automate, unreliable for small events
An example of the data analysis procedure for the ML and Mw estimations. Grey window marks the interval used in the spectral analysis.
Local magnitude scale Ml = log(amp) + 1.11 log (dist) + 0.0019 dist Spectral parameters for moment magnitude P-velocity: 1.7 km/s S-velocity. 1.1 km/s Density 2.7 g/cm2 Attenuation: Q=58f0.4
SLOPE OF THE SPECTRAL DECAY STRESS DROP CORNER FREQUENCY
Seismic attenuation f: frequency t: time ĸ: near surface attenuation
Calculation of κ . On top is show each individual spectrum used for the average spectrum seen at the bottom. In this case the value of κ was 0.024
A typical event with a good signal to noise ratio, magnitude Ml=0.3. On top is shown the seismogram with the spectral window (1.5 s long) and the Q-corrected spectrum is seen below. The 3 curves show the theoretical spectrum with different near surface attenuation choices.
Ml = 1.28 Mw + 0.03 Ml = 1.36 Mw + 0.42
Automatic Mw vs manual Mw (left) and automatic corner frequency vs manual corner frequency (right)
Automatic processing using different κ (symbol k on figures),. To the left is shown the automatic Mw vs manual ML and to the left automatic corner frequencies vs automatic corner frequencies. We see that as κ increases, the automatic fitting becomes increasingly difficult.
Two displacement spectra corrected with κ=0.025. One event has ML = -0.5 and the other 1.0. The figure shows that both spectra have been ‘flattened in most of the frequency range where a signal to noise ratio larger than 1. The ML =1.0 event, might have a corner frequency of 30 Hz which is not an unreasonable value for a this size event. However, the main thing is that MW can be determined manually, even with a κ of 0.
Conclusions • - Ml stable for events down to magnitude –2 and a good reference magnitude • Mw can only be used if proper near surface atteneuation is used • Automatic spectral fitting works well for small events, but corner frequecy cannot be determined due to near surface atteneuation