Download
1 / 2
20 likes | 84 Views
Done by Chen Han, Zhang Tianwei and Zhao Yichen. U.S.A. Average Salary of Teachers & By States. Introduction. Possible Reasons For The Obervation. Research Questions.

E N D
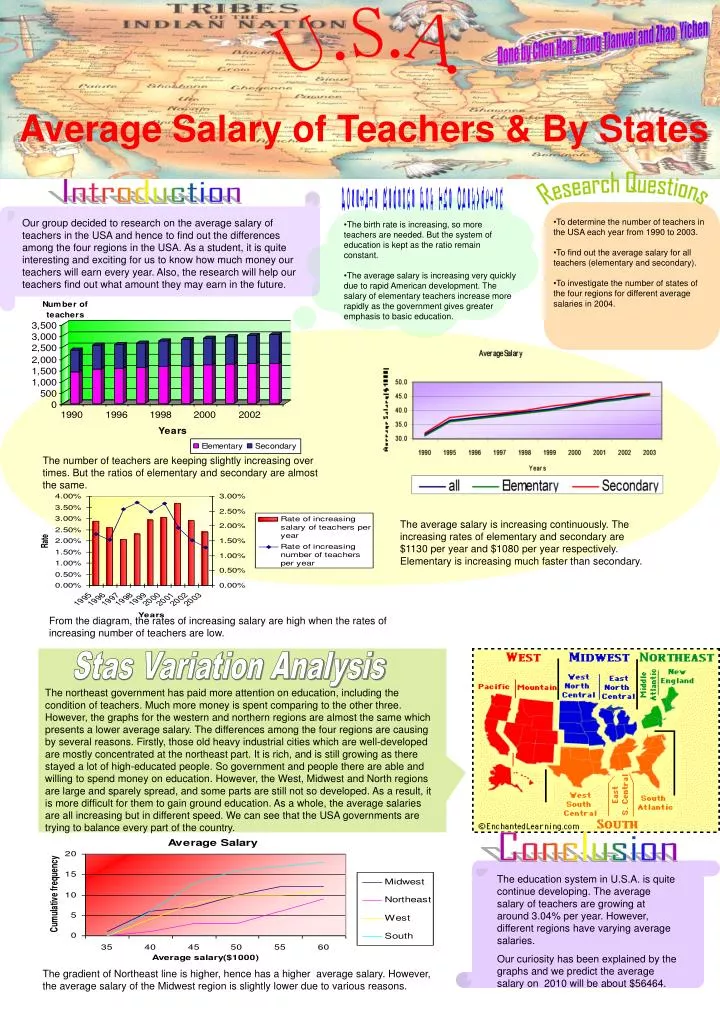
Done by Chen Han, Zhang Tianwei and Zhao Yichen U.S.A. Average Salary of Teachers & By States Introduction Possible Reasons For The Obervation Research Questions Our group decided to research on the average salary of teachers in the USA and hence to find out the differences among the four regions in the USA. As a student, it is quite interesting and exciting for us to know how much money our teachers will earn every year. Also, the research will help our teachers find out what amount they may earn in the future. • To determine the number of teachers in the USA each year from 1990 to 2003. • To find out the average salary for all teachers (elementary and secondary). • To investigate the number of states of the four regions for different average salaries in 2004. • The birth rate is increasing, so more teachers are needed. But the system of education is kept as the ratio remain constant. • The average salary is increasing very quickly due to rapid American development. The salary of elementary teachers increase more rapidly as the government gives greater emphasis to basic education. The number of teachers are keeping slightly increasing over times. But the ratios of elementary and secondary are almost the same. The average salary is increasing continuously. The increasing rates of elementary and secondary are $1130 per year and $1080 per year respectively. Elementary is increasing much faster than secondary. From the diagram, the rates of increasing salary are high when the rates of increasing number of teachers are low. Stas Variation Analysis The northeast government has paid more attention on education, including the condition of teachers. Much more money is spent comparing to the other three. However, the graphs for the western and northern regions are almost the same which presents a lower average salary. The differences among the four regions are causing by several reasons. Firstly, those old heavy industrial cities which are well-developed are mostly concentrated at the northeast part. It is rich, and is still growing as there stayed a lot of high-educated people. So government and people there are able and willing to spend money on education. However, the West, Midwest and North regions are large and sparely spread, and some parts are still not so developed. As a result, it is more difficult for them to gain ground education. As a whole, the average salaries are all increasing but in different speed. We can see that the USA governments are trying to balance every part of the country. Conclusion The education system in U.S.A. is quite continue developing. The average salary of teachers are growing at around 3.04% per year. However, different regions have varying average salaries. Our curiosity has been explained by the graphs and we predict the average salary on 2010 will be about $56464. The gradient of Northeast line is higher, hence has a higher average salary. However, the average salary of the Midwest region is slightly lower due to various reasons.
Original Data References: http://www.census.gov/compendia/statab/education/