Download
1 / 16
160 likes | 165 Views
This project focuses on assessing the benefits of conservation practices implemented in cropland areas. It involves sampling and modeling based on NRI sample points, as well as farmer surveys. The project aims to estimate field-level and off-site water quality benefits by integrating data into large-scale models.

E N D
Analytical Approach • Sampling and modeling approach based on a subset of NRI sample points. • Farmer survey conducted to collect needed information at these NRI sample points. • Physical process model (APEX) will be used to estimate field-level benefits. • Off-site water quality benefits obtained by incorporating field-level estimates into a large-scale water quality model (HUMUS/SWAT).
Implementing CEAP Cropland Component • Initial focus is on water quality, soil quality, and water use conservation. • The most common practices will be addressed first • As the project progresses, the scope will be expanded.
Onsite Effects • Reductions in nutrient loss from fields • Reductions in erosion and sediment loss from fields • Increased water use efficiency • Soil quality enhancement, including carbon sequestration • Reductions in pesticide loss from farm fields and environmental risk
Off-Site Water Quality Effects • Reductions in in-stream nutrient concentrations. • Reductions in in-stream sediment concentrations. • Reductions in in-stream pesticide concentrations and environmental risk. • Reductions in the number of days during the year that in-stream nitrogen concentrations exceed the drinking water standard. • Reductions in the number of days during the warm summer months that in-stream nitrogen and phosphorus concentrations exceed critical thresholds related to algal blooms and eutrophication.
The CEAP Sample and Farmer Survey The CEAP sample is drawn from cropland points in the NRI. • Cropped subset: 13,000 useable surveys have been obtained from 2003-2004 samples. Represents 7% of cultivated cropland NRI points. • CRP subset: 4,000 useable points have been obtained. Represents about 22% of CRP points in the NRI.
CEAP Sample—Cropped Points For points with crops grown, the survey provides: • Three years of crop and cropping practice information • Crops grown, seeding rates, etc. • Nutrient applications, including manure • Pesticide applications and management practices • Field operations, including tillage • Irrigation practices • Conservation practices • Program participation
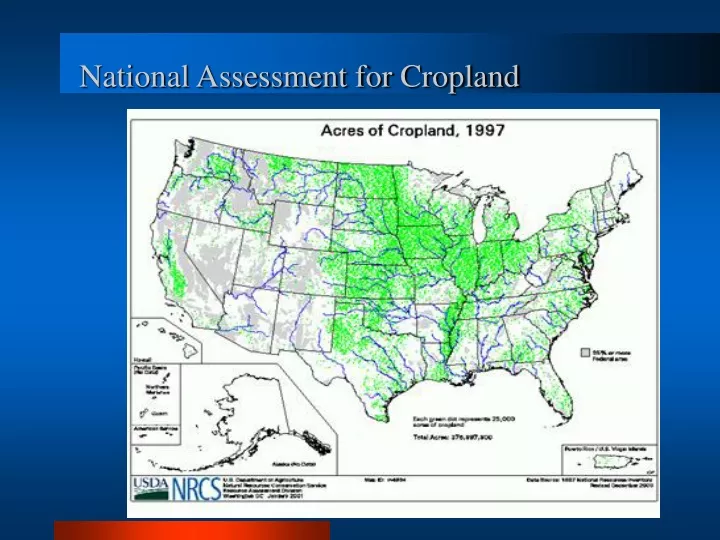
National Assessment for Cropland Work Plan for the Cropland Component of the Conservation Effects Assessment Project National Assessment January 24, 2004 USDA, NRCS USDA, ARS Texas Agricultural Exp. Station (TAES)
Modeling Strategy Two Overarching Goals: • Estimate the benefits of the accumulation of conservation practices currently in place. • Construct a “CEAP Baseline” using survey information. • Construct an alternative scenario assuming no practices. • Estimate benefits for practices implemented each year for comparison to annual program expenditures.
Field-Level Modeling for Construction of the CEAP Baseline and Alternative Scenario • Baseline—simulation of farming activities and conservation practices as reported in the CEAP Survey Database. • 42-year simulation using actual weather for 1960-2001 • CRP sample points modeled with practice cover • Alternative “no practices” scenario • Conservation practices are “turned off” • Cropped subset used to simulate cropping possibilities on CRP points • First set of results will be generated based on 2003-2004 samples and used for Farm Bill assessments.
CEAP Baseline, onsite estimates Farm survey and NRI data at CEAP sample points Field-level modeling (APEX) CEAP Baseline, off-site water quality estimates Watershed modeling (HUMUS/ SWAT) Schematic for Construction of CEAP Baseline
Modeling Strategy Two Overarching Goals: • Estimate the benefits of the accumulation of conservation practices currently in place. • Construct a “CEAP Baseline” using survey information. • Construct an alternative scenario assuming no practices. • Estimate benefits for practices implemented each year for comparison to annual program expenditures.
Subset of CEAP sample points linked to a geographic area Model results for “with practices” scenario Field-level modeling using CEAP sample points Per-acre estimates of conservation practice benefits Acres of combinations of practices implemented in a given year and geographic area Model results for “without practices” scenario Schematic for Estimating Annual Benefits
Questions? Comments? • Robert L. Kellogg USDA-NRCS, Washington, DC (202) 720-0127robert.kellogg@usda.gov • Website at: www.nrcs.usda.gov/technical/nri/ceap