Download
1 / 1
40 likes | 219 Views
Harvesting Environmental White Noise to Perform Structural Health Monitoring with Fiber Bragg Grating Sensors. Abstract. Justin Colar Civil Engineering Alabama A&M University. Dr. Curtis Banks Mentor EV-43.

E N D
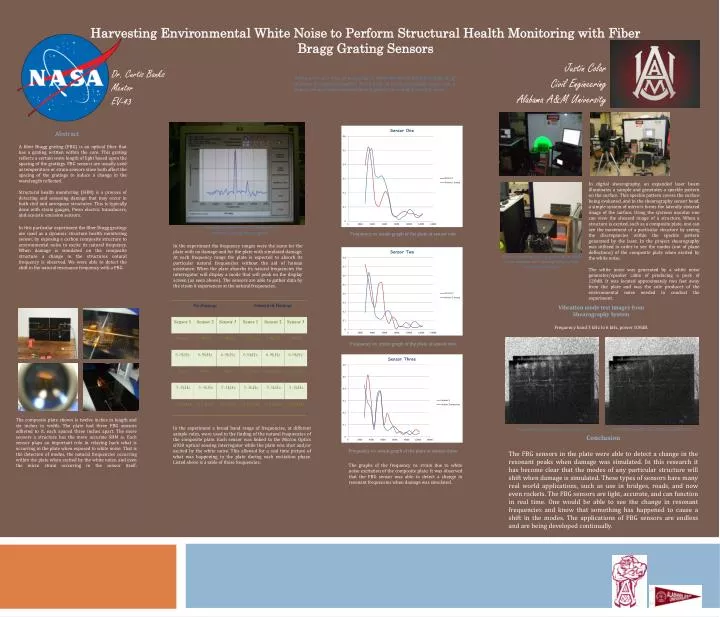
Harvesting Environmental White Noise to Perform Structural Health Monitoring with Fiber Bragg Grating Sensors Abstract Justin Colar Civil Engineering Alabama A&M University Dr. Curtis Banks Mentor EV-43 • A fiber Bragg grating (FBG) is an optical fiber that has a grating written within the core. This grating reflects a certain wave length of light based upon the spacing of the gratings. FBG sensors are usually used as temperature or strain sensors since both affect the spacing of the gratings to induce a change in the wavelength reflected. • Structural health monitoring (SHM) is a process of detecting and assessing damage that may occur in both civil and aerospace structures. This is typically done with strain gauges, Piezo electric transducers, and acoustic emission sensors. • In this particular experiment the fiber Bragg gratings are used as a dynamic structure health monitoring sensor, by exposing a carbon composite structure to environmental noise to excite its natural frequency. When damage is simulated on the composite structure a change in the structures natural frequency is observed. We were able to detect the shift in the natural resonance frequency with a FBG. • White noise is a type of noise that is produced by combining sounds of all different frequencies together. If you took all of the imaginable tones that a human can hear and combined them together, you would have white noise. • In digital shearography, an expanded laser beam illuminates a sample and generates a speckle pattern on the surface. This speckle pattern covers the surface being evaluated, and in the shearography sensor head, a simple system of mirrors forms the laterally sheared image of the surface. Using the systems monitor one can view the sheared image of a structure. When a structure is excited, such as a composite plate, one can see the movement of a particular structure by seeing the discrepancies within the speckle pattern generated by the laser. In the project shearography was utilized in order to see the modes (out of plane deflections) of the composite plate when excited by the white noise. • The white noise was generated by a white noise generator/speaker cable of producing a peak of 120dB. It was located approximately two feet away from the plate and was the sole producer of the environmental noise needed to conduct the experiment. The composite plate shown is twelve inches in length and six inches in width. The plate had three FBG sensors adhered to it, each spaced three inches apart. The more sensors a structure has the more accurate SHM is. Each sensor plays an important role in relaying back what is occurring in the plate when exposed to white noise. That is the detection of modes, the natural frequencies occurring within the plate when excited by the white noise, and even the micro strain occurring in the sensor itself. Resonant peak observed using si920 optical sensing interrogator. Frequency vs. strain graph of the plate at sensor one. Pictures showing the composite plate, white noise speaker, and shearography system used in the project. • Vibration mode test images from Shearography System • Frequency band 3 kHz to 6 kHz, power 108dB. Frequency vs. strain graph of the plate at sensor two. In the experiment the frequency ranges were the same for the plate with no damage and for the plate with simulated damage. At each frequency range the plate is expected to absorb its particular natural frequencies without the aid of human assistance. When the plate absorbs its natural frequencies the interrogator will display a mode that will peak on the display screen (as seen above). The sensors are able to gather data by the strain it experiences at the natural frequencies. Panel with no damage. (modes top left) Panel with weight (1.58 grams) applied to it. • In the experiment a broad band range of frequencies, at different sample rates, were used in the finding of the natural frequencies of the composite plate. Each sensor was linked to the Micron Optics si920 optical sensing interrogator while the plate was shot and/or excited by the white noise. This allowed for a real time picture of what was happening in the plate during each excitation phase. Listed above is a table of those frequencies: • Conclusion • The FBG sensors in the plate were able to detect a change in the resonant peaks when damage was simulated. In this research it has become clear that the modes of any particular structure will shift when damage is simulated. These types of sensors have many real world applications, such as use in bridges, roads, and now even rockets. The FBG sensors are light, accurate, and can function in real time. One would be able to see the change in resonant frequencies and know that something has happened to cause a shift in the modes. The applications of FBG sensors are endless and are being developed continually. Frequency vs. strain graph of the plate at sensor three. • The graphs of the frequency vs. strain due to white noise excitation of the composite plate. It was observed that the FBG sensor was able to detect a change in resonant frequencies when damage was simulated.