Download
1 / 3
30 likes | 388 Views
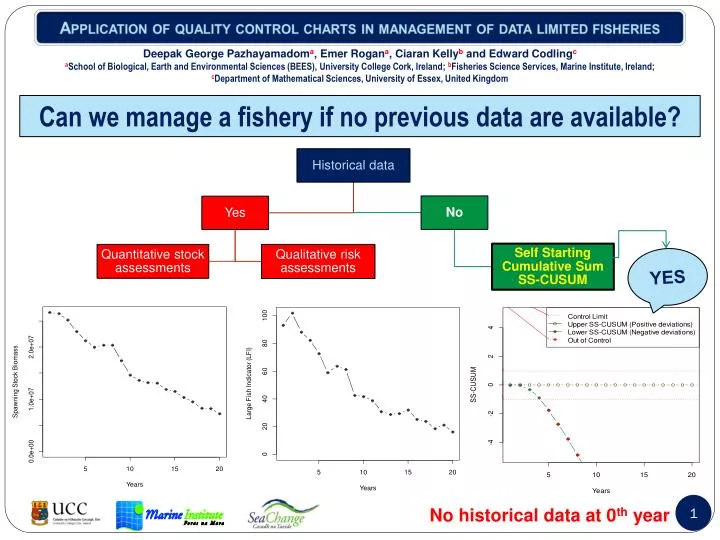
Application of quality control charts in management of data limited fisheries. Deepak George Pazhayamadom a , Emer Rogan a , Ciaran Kelly b and Edward Codling c

E N D
Application of quality control charts in management of data limited fisheries Deepak George Pazhayamadoma, EmerRogana, CiaranKellyb and Edward Codlingc aSchool of Biological, Earth and Environmental Sciences (BEES), University College Cork, Ireland; bFisheries Science Services, Marine Institute, Ireland; cDepartment of Mathematical Sciences, University of Essex, United Kingdom Can we manage a fishery if no previous data are available? YES No historical data at 0th year
SS-CUSUM • SS-CUSUM is an indicator monitoring tool. • SS-CUSUM do not need a reference point. • SS-CUSUM calculate the cumulative deviations of indicator from running mean • Parameters • Allowance (k) accommodate the inherent variability in observations • Control limit (h) produce signal if the indicator is in an out-of-control (OC) situation • Winsorizing constant (w) make self starting CUSUM robust to outliers Evaluation of SS-CUSUM using a stochastic simulation test Indicator observations corresponding to out-of-control situations are omitted while calibrating the running mean • A stable fish stock was overfished and indicators were monitored using SS-CUSUM • Signals obtained from SS-CUSUM were used to calculate sensitivity and specificity • Sensitivity is the probability of getting a true signal when overfishing was applied • Specificity is the probability of getting a true signal when there was no overfishing Performance measures used • Receiver Operator Characteristic (ROC) curves
Results (ROC curves) • SS-CUSUM was successful in detecting the fishing impact. • An indicator is best when the apex of ROC curve is closer to upper left corner. • The method performed best with Large Fish Indicators (LF catch numbers, LF catch weight and LF CPUE). Best Good Worst Conclusion All stock indicators in the study were useful in detecting fishing impact and hence SS-CUSUM can be potentially used for monitoring data poor fisheries Reference: Hawkins, D.,Olwell, D., 1998. Cumulative sum charts and charting for quality improvement: Springer Verlag, pp:162-168.