Download
1 / 34
360 likes | 491 Views
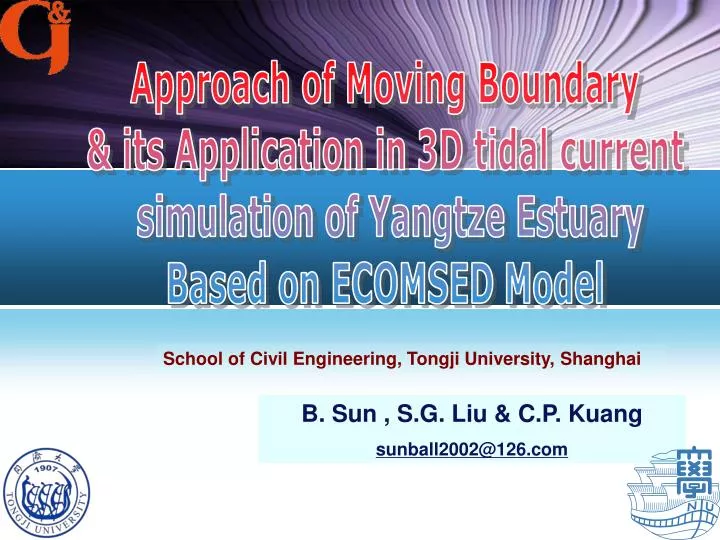
Approach of Moving Boundary & its Application in 3D tidal current simulation of Yangtze Estuary Based on ECOMSED Model. School of Civil Engineering, Tongji University, Shanghai. B. Sun , S.G. Liu & C.P. Kuang sunball2002@126.com. www.themegallery.com. Outline. Introduction. 1.

E N D
Approach of Moving Boundary & its Application in 3D tidal current simulation of Yangtze Estuary Based on ECOMSED Model School of Civil Engineering, Tongji University, Shanghai B. Sun , S.G. Liu & C.P. Kuang sunball2002@126.com www.themegallery.com
Outline Introduction 1 Approach of Moving Boundary 2 3 Numerical Test 4 Application in the Yangtze Estuary 5 Summary
Outline Introduction 1 Approach of Moving Boundary 2 3 Numerical Test 4 Application in the Yangtze Estuary 5 Summary
INTRODUCTIN OF ECOMSED • The ECOMSED is a state-of-the-art hydrodynamic and sediment transport modelwhich realistically computes water circulation, temperature, salinity, and mixing andtransport, deposition and resuspension of cohesive and non-cohesive sediments. • It is dealt in Fortran source code version.
Development of ECOMSED Origins in the mid 1980’s with the creation of the POM (Blumberg and Mellor, 1987) ECOMSED Estuarine Coastal and Ocean Modeling System with Sediments Commercial version forshallow water environments named ECOM (Blumberg, 1996). Incorporated concepts for cohesive sediment resuspension, settling and consolidation , within the ECOM. and enhanced to include generalized open boundary conditions, tracers, better bottom shear stresses, etc.
Consistsof complete model Thecomplete ECOMSED model consists of several modules including sediment transport module, wave module, heat flux moduleand particle tracking module ,and the hydrodynamicmodule. Wave Module Sediment-Transport Module Heat Flux Module Water Quality Module Hydrodynamic Module Particle Tracking Module
Governing Equations Continuity Equation: (1) Momentum Equations: (2) (3) (4) (5)
Mode Splitting Hydrodynamic Module • External Mode • Neglect the vertical structure, in 2D; • Solve the shallow • water wave equations in a short time step • provides depth averaged parameters into the internal mode equations • Internal Mode • consider the vertical structure, in 3D; • solved with a much longer time step. • provides an updated depth averaged parameters to start a new external mode
external ETn-1 ETn ETn+1 To the internal internal Mode Splitting Saving computational time
Estuaries and coastal areas with Extensive tidal flats Yangtze estuary Jiaozhou bay Shandong province pearl river estuary
What disappointed us is that the existing model can’t solve the problem of wetting and drying, thus the real situation of the water movement cannot be reflected accurately by the fixed boundary process. Approach of Moving Boundary An approach to represent moving boundary in the model is introduced here
Outline Introduction 1 Approach of Moving Boundary 2 3 Numerical Test 4 Application in the Yangtze Estuary 5 Summary
Wetting and Drying process (1) water can potentially flood new 2D array water can never flood A mathematically less elegant but numerically easier way to test for dry or wet cells at each time step is by adopting a critical water depth dmin(coastal region 0.1~0.2m ) Water level point:Di,jv.s. dmin
Wetting and Drying process (2) For the velocity points total water depth at the velocity point the total water depth at the water level point the critical water level difference between drying and wetting, which is generally 5cm. condition a) Uij point is set to be wet So is Vij point one of the three conditions b)、c)、d)
Wetting and Drying process(3) • The external mode conditions are necessaryin the WAD scheme used here, but they are insufficient for the general three-dimensional baroclinic flows. • The critical treatment of the approach is the connection of the two modes (internal and external), thus the average velocity and water level is checked in every internal time step to reassure the smooth transition, which also enables a stable computation in a larger time step.
Outline Introduction 1 Approach of Moving Boundary 2 3 Numerical Test 4 Application in the Yangtze Estuary 5 Summary
Numerical Test • to demonstrate the movement of the water front and to examine the stability of the present WAD approach • This test case was used by Heniche.M et al. to qualitatively demonstrate the water front movement and to show the capability of their drying and wetting approach. • the present approach is first demonstrated in a 2D simulation (that is BAROTROPIC mode). • Another previous test result carried out by Y.W.Jiang is also introduced here to make comparison with this test
Rectangular basin with variable slope • Parameters:T=60min; internal time step=0.1s; amplitude=0.75m; bottom friction coefficient = 0.015; dmin=0.05m ; horizontal eddy viscosity coefficient =5m/s2 • initial condition : 50×5 grids
At T= 12 min, there is a significant acceleration of flow near the point x = 100 m where and the velocity is about 0.4 m/s, which is the same as the value at the open boundary. This phenomenon has also been observed in the tests of Heniche and Y.W.Jiang et al. They attributed this phenomenon to the spurious oscillations of the water surface level with the same order of magnitude as the depth values. Hydrodynamic patterns in a tidal cycle (1) the flow is stagnant at the dry grids (u=0) and the water level changes continuously with the surrounding wet grids and total water depth kept to be 0.05m in the dry grids.
Hydrodynamic patterns in a tidal cycle(2) The result shows that the flow and water level patterns of Heniche et al. ,Y.W.Jiang et al. and the present WAD approaches are on the whole quite similar. Comparison of Hydrodynamic patterns of 2D temporal-spatial movement in the rectangular test
The water level pattern is generally the same as the one computed in the 2D model simulation with higher velocity at the water surface and lower velocity at water bottom. 3D Numerical Test (1)
3D Numerical Test (2) This implies that the present improved WAD approach can be used in 3D simulations with good computational stability. Hydrodynamic patterns of 3D temporal-spatial movement in the triangular test
Outline Introduction 1 Approach of Moving Boundary 2 3 Numerical Test 4 Application in the Yangtze Estuary 5 Summary
This model covers a large domain of Yangtze estuary : east to Jiangyin, west to -40m depth contour, north including Qidong tidal flat, and south including Nanhuizui divided into 42104 orthogonal curvilinear grids. Model domain and grid division
upstream boundary : dischargein Jiangyin open sea boundary : water level calculated by 8 different tidal constants(O1 , P1 , K1 , N2 , M2 , S2 , K2 , Q1 ) horizontal mix coefficient:0.1 bottom friction coefficient BFRIC:0.0012 bottom roughness coefficient Z0:0.0001 time step : 15s. Boundary conditions and operational setup
Layout of observed points used to calibrate and validate the model Validating of the model
Validating-water level the computed tidal levels are in good agreement with their measured data water level validation at selected stations (from 06:00 5/5/2004 to 05:00 6/5/2004 )
Validating-current velocity (station csw) Current velocity validation at selected stations (from 05:00 5/5/2004 to 11:00 6/5/2004 )
Validating-current velocity (station cs4) The computed flow velocity and direction also fit well with the measured data except for some minor reduction of the peak value Current velocity validation at selected stations (from 05:00 5/5/2004 to 11:00 6/5/2004 )
Flow field characteristics vertically-averaged flow velocity at times of flood in 5th May, 2004.
Tidal flat intermittent appearance is reproduced successfully due to the flood and ebb tide with the application of moving boundary method. Flow field characteristics vertically-averaged flow velocity at times of ebb in 5th May, 2004.
Outline Introduction 1 Approach of Moving Boundary 2 3 Numerical Test 4 Application in the Yangtze Estuary 5 Summary
Summary • An improved WAD approach is adopted in a 3D sigma finite difference model to predict the tidal hydrodynamics in estuaries with tidal flats. • This approach enables to solve simulation areas including both dry and wet areas. • The test case and the Yangtze Estuary application show that the modified model incorporated with the WAD approach can accurately simulate the drying and wetting processes in different occasions, and can successfully simulated the tidal current of computational areas and reproduced the tideland intermittent appearance.
Thank You ! www.themegallery.com