Download

1 / 38
380 likes | 569 Views
Learning from Feed-in Tariffs Dr. Axel Bree. Roadmap of Presentation. Introducing WFC The Problem Policy Solutions Design of Feed-in Tariffs Tariff Period Burden Sharing Purchase Obligation. Who we are. The World Future Council

E N D
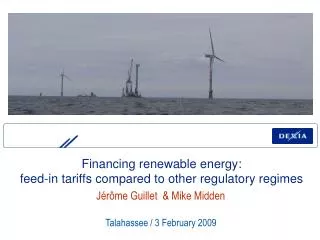
Learning from Feed-in Tariffs Dr. Axel Bree
Roadmap of Presentation • Introducing WFC • The Problem • Policy Solutions • Design of Feed-in Tariffs • Tariff • Period • Burden Sharing • Purchase Obligation
Who we are • The World Future Council • consists of fifty highly respected figures represented in governments, civil society, business, science, education and the arts from all five continents • is an integrated global forum based on mutual ethical values, highlighting our responsibilities as citizens of the earth • strives to mobilise moral energy and political will to protect the rights of future generations 3 Alexandra Wandel | Development Director| alexa@worldfuturecouncil.org
Breakthrough for Renewable Energy:South Australia, UK, USA • South Australia has implemented a law to promote renewable energy. South Australian Premier Minister Mike Rann highlighted explicitly the role of the WFC with regard to the implementation and realization of the law. • The renewable energy law has a good chance to be passed in UK. WFC has advised the leading decision makers on legislative procedure. By now a large coalition (led by FoE and REA) pushes for the adoption of a FIT amendment. • On the basis of WFC activities there are further parliamentary legislative initiatives in California, Michigan, Minnesota, Hawaii and Washington DC. 4
Increasing CO2 and temperature levels Increasing energy consumption Increasing fossil fuel prices Increasing volatility of energy prices What is the problem?
Costs and pricing: distortion from subsidies for competing fuels; fluctuation of oil and gas prices; high initial capital costs; environmental externalities Legal and regulatory: Lack of legal framework for independent power producers; planning restrictions; grid access; liability insurance requirements (net metering) Market performance: lack of access to credit; Perceived technology performance uncertainty and risk; Lack of technical or commercial skills and information Barriers to Market Entry for RES
Distorted market conditions Source: BEE, Lackmann, 2005 7
Renewable Energy Payments (Feed-in systems) in Europe Source: Klein et al. 2006: Evaluation of different feed-in tariff design options – Best practice paper for the International Feed-in Cooperation.
Quota vs. FIT System Quota FIT Long-term investment security Equal chances for all technologies Lower costs No upper limits Incentives can be set via tariff • Closer to market approach • Promote least cost technologies and large scale projects • Provide certainty of future market share • Higher risk -> risk premium • Administrative burden
Germany – Feed-In system UK – Quota-System- and Auction-based system Installed RE capacity in Germany and the UK (1990-2003) Source: Butler/Neuhoff 2004, Cambridge Working Papers in Economics
Comparison of Quota TGC and Feed-in Tariffs Tradable certificates vs FITs Source: Haas et al 2006 Alexandra Wandel | Development Director| alexa@worldfuturecouncil.org
Pieces of the FIT Puzzle Tariff period Tariff level Burden sharing Purchase obligation
Tariff Level • Generation costs / avoided external costs • Fixed tariff / premium tariff • Stepped up tariff (wind yield, plant size, fuel type) / flat tariff
Premium Tariff • Premium is paid on top of electricity market price • (ESP, CZ, SI, NL, DK) • Advantage for producer when energy prices are high • Higher oil prices lead to higher cost per kWh RES-E • + higher comparability with liberalised energy markets • Higher risk for producer (no purchase obligation) • Solution could be a top or bottom limit (as in DK)
Connection to the grid: paid by the plant operator Essential grid upgrades: paid by the grid system operator Metering devices: paid by the plant operator RE contribution: paid by consumer (only 3,5% of bill) EEG added €2.94 to the monthly electricity bill per household in 2007 (equivalent to a pint of beer or a Starbucks latte!) Costs
Advantages of Renewable Enery Payments at a glance Overcomes barriers: guarantees grid access; premium price guarantees support for the technology; 20-year tariff periods allow full investor confidence. Supports installations of different sizes and technologies: In addition to large RE projects for wind, solar etc, householders can now get a guaranteed payback on a solar roof in just a few years, rather than 20-30 years. The 100,000 solar roof programme helped meet costs with subsidies. Promotes innovation: Annual reduction of tariffs for new installations drives technological efficiency. Drives economies of scale: investment and demand are rising, and manufacturing expansion is taking place globally in response, lowering costs further. Promotes stability: Change of government does not affect system, as it does not cost taxpayers anything through taxes, and so cannot be cut from national budget. Promotes public support: Through public participation in the scheme, no direct taxpayer costs, support for the nuclear phase-out, and awareness levels being very high in general. All possible when implemented properly!
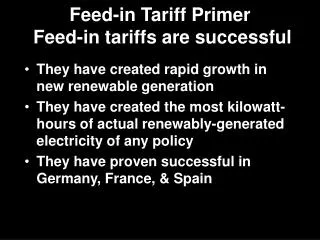
12-20 year contracts create long term planning security Crucial to investors Gives technology-specific incentives Crucial for driving new technologies into the market Adapts to technological development Fosters innovation Why have Renewable Energy Payments been so successful?
Approx. 134.000 jobs in the field of renewable energy technologies created by the EEG RE overall 249.300 jobs in 2007 Approx. € 14.2 billion turnover through the EEG RE overall € 25 billion turnover in 2007 Avoided external costs approx. € 3,4 billion (in 2006) Avoided energy imports approx. € 1,0 billion (in 2006) Impact of the EEG – Economic benefits
Apply the following formula to pricing: (investment cost + operating cost) / expected production over service life = compensation per kilowatt hour. Add on a reasonable profit margin, and voilà -- you have your rate per system type (size / source, etc.). Now estimate cost decreases due to expanding market and reduce your rates accordingly. Revisit every few years to tweak the figures. How would you best replicate the German system of feed-in tariffs/subsidies?
Check out: www.onlinepact.org and www.AllianceforRenewableEnergy.org
Thank you for your attention. www.worldfuturecouncil.org
Economic Impact: Development of New Industry Source BMU 2008
Renewable Energy Payments have made Germany the world leader in solar power 54% of all solar power capacity worldwide is located in Germany
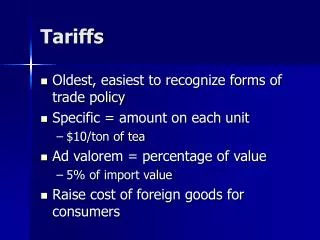
Renewable Energy Incentive Policies • Feed-in tariffs • Quota obligation system • Tender • Tax incentives, grants
Jobs in the renewable energy sector in Germany in 2007 Source: BMU March 2008
Climate Impact: Reducing CO2 Emissions Source: BMU March 2008
Quota Obligation/Tradable Green Certificate System (Example Poland) • Companies selling electricity to final consumer must satisfy quota obligation (2008: 7.0%) • TCGs guarantee compliance with quota obligation • TCGs are granted to RE producers per MWh • RE producer sells TCGs separatly • Price is determined by market and technology neutral • Substitution fee, penalty • Additional obligation to buy all RES at average market price
„Comparisons … suggest that [pricing] mechanisms achieve larger deployment at lower costs. Central to this is the assurance of long-term price guarantees…. Uncertainty discourages investment and increases the cost of capital as the risks associated with the uncertain rewards require greater rewards.“ Sir Nicholas Stern (former Chief Economist and Senior Vice-President of the World Bank): – Stern Review: The Economics of Climate Change p. 366
Reduced risk: Renewable Energy Payments (in Europe known as Feed-in Tariffs) deliver lower prices compared with renewable energy certificates
Solar Resource and Market U.S .: ~150 MW PV in 2007 10-20% capacity factor Germany: ~1000 MW PV in 2007 9-13% capacity factor Solar Resource Availability: NREL, PV Capacity Additions: SEPA
Déjà Vu We have always used nature‘s energy for our needs
Development of electricity generation from RE in Germany, 1990-2007 Source: BMU March 2008
Criteria for effectiveness of Incentive Instruments • Long term planning security • Differentiated assistance for different types of technology and scale of plants • Political feasibility and administrative applicability