Download

1 / 15
150 likes | 223 Views
Basic Image Processing. February 1. Homework. Second homework set will be online Friday (2/2). First programming assignment will be online Monday (2/5). Slides will be posted online before the end of next Monday. Today, we will finish Chapter 6. We will work on Chapter 7 and 8 next Tuesday.

E N D
Basic Image Processing February 1
Homework Second homework set will be online Friday (2/2). First programming assignment will be online Monday (2/5). Slides will be posted online before the end of next Monday. Today, we will finish Chapter 6. We will work on Chapter 7 and 8 next Tuesday.
Recall that we introduced a linear noise model Optimal filtering: Find a filter that maximally suppresses the noise. An application of the math we have been studied so far!
Changing the notation slightly (following the textbook) o is the output signal, with h the (unknown) filter kernel (point-spread function) that we want to figure out. Find h that minimizes this error functional.
The expression for E become complicated (only in appearance !)
Auto-correlation and cross-correlation Given two functions, a, b, their cross-correlation is defined as The auto-correlation of a function is the cross-correlation between itself: Recall that cross-correlation and auto-correlation are functions, not just a number.
Some important properties of correlations. (0, 0) is a global maximum of auto-correlation. If then The Fourier transform of autocorrelation is called power spectrum.
The cross-correlation of the two images have maximum at (100, 200). The two auto-correlations are the same (invariant under translation).
Remember, we want to determine h. This is a calculus of variation problem! Want to find h such that That is,
How to get h? That is, we only need to know the power spectra. From Assume that the noise and signal are not correlated.
We have is the signal-to-noise ratio (for each frequency). SNR is high, the gain is almost unity. When SNR is low (mostly noise), the gain is small.
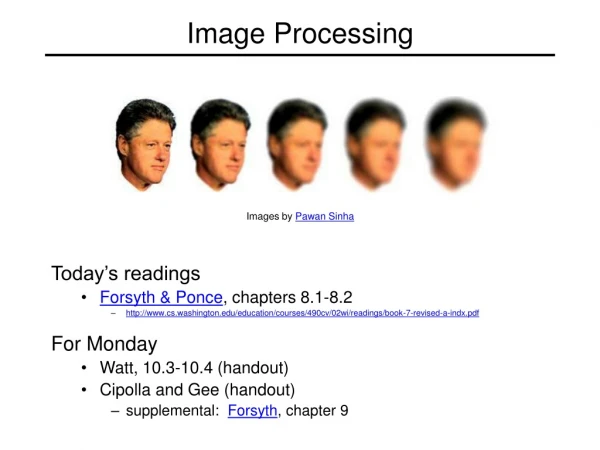
Similar applications Suppose now we have Examples: Image Blurring: Defocusing: Motion Smear: image points smeared into a line.
Need to figure out Assume that the noise and signal are not correlated.
SNR is high In parts where SNR is low The gain is roughly