Download
1 / 22
220 likes | 227 Views
Explore the connection between morality, immorality, and statistical information in economic decision-making. Discover how measurement and quantification can simplify and sometimes ignore important information.

E N D
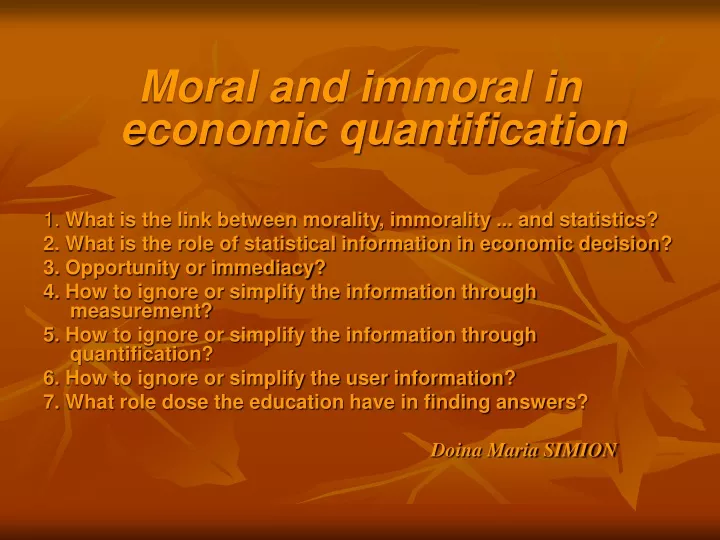
Moral and immoral in economic quantification 1. What is the link between morality, immorality ... and statistics? 2. What is the role of statistical information in economic decision? 3. Opportunity or immediacy? 4. How to ignore or simplify the information through measurement? 5. How to ignore or simplify the information through quantification? 6. How to ignore or simplify the user information? 7. What role dose the education have in finding answers? Doina Maria SIMION
In private, I want to be: Healthy!!! Activ !!! Strong !!! So I have to eat: Cautious ! Consistent ! Fresh ! Identical in the professional life: I want to be: Healthy!!! Activ !!! Strong !!! So I have to inform myself: Cautious ! Consistent ! Fresh ! Therefore, I needSTATISTICS!!!
Which is the linkbetween morality, immorality ... and statistics? Today, we speak more and more about morality and immorality • between individuals, • in and between social grups, • in the world of ideas andscience. We ask ourselves: • What can be immoral in art? • What can be immoral in medicin? • What can be immoral in IT? • But what can be immoral in Statistics (scienceandpraxis)? etc. etc. The answer was given by a famous painter: “What is immoral in art is to make art without being talented” Therefore I understand that imoralityin science, art andpraxisarisesand evolveswhere there is no: • talent, • vocation, • calling, • resonance, • enough knowledge. Immoral is to use the scientific knowledge unwise andincorect.It has to be brought as close as possible to the real world, the social and economic reality in which we live.
Role of statistical information in economic decision Entropic law => work and information => anti-entropy factors => >>> <= high entropy LACK of workandinformation <= <<<
Decisional activities succeeds proceeds conditions Informational activity
Opportunityorimmediacy? • Information (in this case statistical) has to possess the following esential qualities: • to be necesary, • to berelevant (related to topic), • to be exact and complete (without overflow ), • to berecent and oportune (submitted in time), • to be economically efficient, i.e. ocazional expendituresofcollection, transmission, processingandstoragehave to be compensatedby the benefitsthat derive from its use in economic decision making. • To be oportune!? The scroll speed of life, of the economic and social phenomenon and processes, is so fast at the beginning of this century it generates the immediacy ofhuman needsthat we face today.This requires action priority, speed, sacrifice,kneading and generates a pretty obviousfeatureof the modern mentalitynamely oversimplification. Whose? Reality's. Speed of action immediacy simplification This state of affairs changes something in, what was called by the `80 literature information opportunity, in this case statistical information.
Immediacy + ignorance ofstatistical theory = = mistakeand / or “lie” STATISTICAL INFORMATION PROVIDER WITH COMPUTER WITHOUT COMPUTER STATISTICAL INFORMATION USER
How to ignore or simplify the information by measurement? What does it mean to measure? 1. We determine the value of an indicator, directly, as a ratio of the indicator we measure to its measurement unit. 2. To measure also means to determine the value of an indicator indirectly, by using a formula which uses values obtained by direct measurement Here we find the sensitive point: the formula. • When, where, and who launched (designed) it? • Who uses it, when, where, and how? There are theoretical areas of economic analysis which take the formula out of its statistical context, and use it as one would use an instrument taken out of a kit, without remembering to put it back in its place every now and then, in the matrix where it was designed, tested, used and eventually redesigned. In other words, forgetting to re-place the formula within the category it belongs to, to recall again the principles of this category in order to use it correctly. We use indices, create derivatives based on them, and ignore or maybe forget the „mother” category with all that is specific to it.
Ex 1: The Dow Jones index is, at its origin, an average index belonging to the average category. When the stock exchange activity diversified and quotation divisions were introduced, the index was taken out of its matrix (statistical mathematics) and adapted to the economic area where it was used. The effect of share divisions is corrected by the calculation of a divider, which is periodically updated. The indicator is no longer an average value, an instrument that can be generalized for any domain, it was „ripped” out of its matrix, particularized and „stuck” in the subject matter of Wall Street transactions.
How do we ignore or simplify the information by quantification? What happens through quantification? We establish the discontinue that values and indicator may have, we impose conditions on an indicator such that its values vary in waves. We go from quantics, from the atomicity of the economic and social space to the macroscopic world of companies, of institutions, of societies, of the structures which make up the economic and social architecture of this world. Here happens a great loss! Reality!Truth! Reality? Truth? We synthesize the results, as they occur in every atom, simply by making them discrete and then adding them up. Then we create their corresponding statistical design, systemize them on the interval scale, obtain statistical distributions, distribution tables, contingency tables, association tables, without asking ourselves how much of the economic and social space we are studying stays in the „shapes” we have created statistically.
Data on annual net profit achived andnominal value of shares issued on the market for 27 companies of a range of activities have beensummarized in the following tables: a. Using primary data:
b. Using systemized data: What effect has this significant difference on further economic analysiswhen the above indicator, astructural indicator, enters as primary data?
Partial conclusion: The social and economic reality is not some easily modelled plasticine, it is amaterial and spiritual mixture of existence, which theoretical systems we must approach with caution They must approach it: • in good knowledge • in wise patience, • with deep understanding, • with professional friendship that is, with talent and vocation.
How to ignore or simplify the user information? The information does not consist only of the data and the indicators obtained from the statistical analysis, but also of the specificity given by the user’s professional, economic, social, and scientific context. Ergodicity refers to the manner in which information users infer various things, reach a conclusion on something based on information about something else. Low transinformation means low understanding Rich transinformation means high understanding We speak of transinformation, as a factor for reducing enthopy. From a theoretical perspective, transinformation is defined as the information about the emitter contained in the receiver field, or as a correspondence between the emitted and the received message. How much of what information users know is statistical information?
Ex: Analyzing the dynamics of a phenomenon using: • - „annual change” • - “change at end of year” • - „changes in current year” • - “changes after 12 month” • - „annualized change”
A subjective probability always depends on what the receiving subject, the information user knows at a given time about the phenomenon studied, or about the method of analysis. In other words, the content of information is equally determined by the provider (emitter) and by the user (receiver). If somebody knows the market evolution of a soft drink over the past years, and the methods by which its dynamics can be studied, then an evolution index, or a seasonality index, or a future estimated level can be more or less plausible, relevant or significant for the one who informs himself. More so for the situations when that someone is the decision maker in a structure.
Final conclusion: Any particular economic analysis (of value, of dynamics, of correlation, etc) gives specificity to the scientific instrument and methods used, fills them with meaning To conduct such an analysis with professional responsibility is a commendable act. To do is with professional virtue is excellence. Professional responsibility involves effort, professional virtue involves joy. The philosophers of our times note with sadness that today we speak more about professional responsibility than we do about professional joy. And this is another abyss in which the world of science turns into darkness.
Some notes: ! Statistical procedures simply work. Not knowing them pushes towards automatism.To be useful we must feed them real, healthy data, with realsocial and economic content….. knowing what we give and what we ask for. • A manager asks a statistician to determine in what extent two rows of data representing changes over a period of time (9 years) of two variables correlate. The statistician with or without a computer calculates the correlation coefficient and finds that the variables correlate with a high intensity of 93%.What were the variables? What has the statistician calculated? No more and no less then the correlation between the level of housing loans granted by the banking system in Romania with beans production in these nine years.
! Do we give / receive complete information for a good decision? • A rate of sales growth of 177% is announced but the factorial indexes for this analyzed case I(p) = 197% and I(q) = 90 % are not known. What weighting systems was used? Which indicator is made public by the analyst? But by the decision-maker? How to use the information given and how to request additional information for good decision? • A promise of a higher average salary is announced but no one announces also the coefficient of variation to see how credible this average is. • A statistical survey result is announced, but information about the error with which they worked or the degree of significance is not provided.
! Do we know how to discern the abundance of information? • Calculation by Hirschman, Gini-Corado, Stuck or other methods applied on one and the same case leads to different results. Dose the recipient of the information have sufficient knowledge of statistics to understand that the difference between these levels mean the same thing? • The calculation of correlation and regression on the same volume of data through different parametric or non-parametric methods lead to different final results. Dose the statistics information provider have the good professional sense to give the most relevant version of his study?