Download
1 / 44
490 likes | 768 Views
The Academic Program Review. Bridging Standards 7 and 14 Middle State’s Annual Conference December 10, 2010. Presenters. Mr. H. Leon Hill Director of Institutional Research Dr. Joan E. Brookshire Associate Vice President of Academic Affairs. Overview. Framework to Address the APRs

E N D
The Academic Program Review Bridging Standards 7 and 14 Middle State’s Annual Conference December 10, 2010
Presenters Mr. H. Leon Hill Director of Institutional Research Dr. Joan E. Brookshire Associate Vice President of Academic Affairs
Overview • Framework to Address the APRs • Structure/Challenges/Approach • Examples of Metrics • Current Action Plan • Integration of “End User” Technology • Next Steps • Benefits of Our Approach • Questions
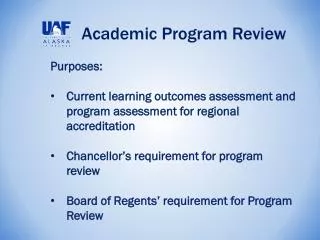
What we had to build on • Strong focus on programs. • State mandated 5-year academic program review in need of revision. • Institutional Effectiveness Model (IEM) with performance indicators benchmarked through State and National data bases.
Mission Strategic Initiative: Access & Success Institutional Effectiveness
IEM • Needed a way to assess how the College was performing on key metrics in relation to prior. years/semesters and compared to other institutions. • Historical/Trend data • Benchmark data • Pennsylvania & National Peers
Where we started • Restructured the Academic Program Review process • Incorporated the use of technology
Goal of the restructuring • Measure student performance as evidence by results of assessment of student learning outcomes. • Measure program performance as evidenced by comparison of program performance to overall college performance on specific key indicator (current and aspirational).
Challenges • Usual issues with assessment in general. • Faculty had little knowledge of the College’s performance indicators. • Organizational separation of assessment of institutional and student learning outcomes.
Approach Began by building it backwards from the IEM by mapping out specific core indicators to program data, making additions where needed.
Definitions of Success & Retention Success=Grades of (A,B,C & P)/(A, B, C, D, P, D, F, & W) Retention=Grades of (W)/(A, B, C, D, P, D, F, & W)
Added a curricular analysis • How well program goals support the college’s mission. • How well individual course outcomes reinforce program outcomes. • How well instruction aligns with the learning outcomes.
Specific assessment results. • Changes made based on the assessment findings. • Evidence of closing the loop • Changes made to the assessment plan.
Action Plan • Outcomes expected as a result of appropriate actions steps. • Timelines and persons responsible for each action step. • Resources needed with specific budget requests. • Evaluation plan with expected benefits.
Bottom Line • Is there sufficient evidence that the program learning outcomes are being met? • Is there sufficient evidence that the program is aligned with the college on specific key indicators?
The Framework Assessment Results Curriculum Committee President’s Office Curriculum BOT & BOT
Addition of Technology • Worked in concert with Information Technology to integrate iStrategy with ERP (Datatel). • The implementation of this permitted end users to obtain the data needed for program assessment, without the middle man (IR and/or IT).
Next Steps in the Evolution of of College and Program Outcomes
Benefits • Build a bridge between Standards 7 and 14. • Better data. • By putting data in the hands of faculty, have them actively engaged with using data in decisions/planning. • IR time better used.
Annual planning cycle developed. • Built a culture of assessment in several of the academic divisions. • Curricular changes that align with graduation initiative. • Curricular and program improvement. • Created a college-wide model for improvement of student learning.
Evolution of the Dashboard • Creation of a Student Success Dashboard Metrics: • Course level success and retention (Developmental and College-Level) • Persistence (fall to spring and fall to fall) • Progression of various cohorts of students • College level success in Math or English after Developmental Math or English • Graduation • Transfer
Final Thoughts • It’s not perfect, but it works for us. • Do the research on which tools are appropriate for your college • Assessment of the core curriculum • Launching of assessment software • It all starts with asking the right question • PRR 2010
Presenters Mr. H. Leon Hill hlhill@mc3.edu Director of Institutional Research Dr. Joan E. Brookshire jbrooksh@mc3.edu Associate Vice President of Academic Affairs