Download
1 / 26
260 likes | 462 Views
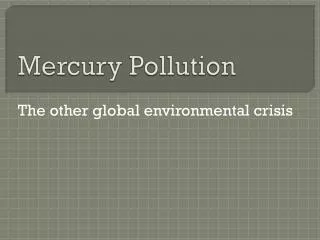
The Mercury Cycle. Ubiquitous environmental toxicantVolcanoes and other natural sources release some elemental mercury to the environmentAnthropogenic emissions now account for approximately 70% of the 5500 metric tons of mercury that are released into the earth's atmosphere each yearCoal-fired power plants, chlorine plants, incineratorsThree forms: the metallic element, inorganic salts, and organic compounds (methylmercury, ethylmercury and phenylmercury)each possesses different bioavailab32204

E N D
1. Health and Economic Consequences of Mercury Pollution in America Leonardo Trasande, MD, MPP
Philip J. Landrigan, MD, MSc
Center for Children�s Health and the Environment
Mount Sinai School of Medicine
2. The Mercury Cycle Ubiquitous environmental toxicant
Volcanoes and other natural sources release some elemental mercury to the environment
Anthropogenic emissions now account for approximately 70% of the 5500 metric tons of mercury that are released into the earth�s atmosphere each year
Coal-fired power plants, chlorine plants, incinerators
Three forms: the metallic element, inorganic salts, and organic compounds (methylmercury, ethylmercury and phenylmercury)
each possesses different bioavailability and toxicity
3. Mercury in the Environment Elemental mercury readily aerosolized
Once airborne deposits into soil and water
Transformed within microorganisms into methylmercury
Microorganisms subsequently consumed by fish, which are in turn eaten by larger fish
Methylmercury reaches very high concentrations in predatory fish such as swordfish, tuna, king mackerel and shark
Consumption of contaminated fish is the major route of human exposure to methylmercury.
4. Mercury in the Environment
5. Evidence for Methylmercury Toxicity in American children Strongest evidence for cognitive impacts
New Zealand: three-point IQ loss in Wechsler full-scale IQ among children born to women with maternal hair Hg > 6 mg/g (Kjellstrom et al 1986 and 1989)
Seychelles: only adverse association with performance on grooved pegboard test with nonpreferred hand (one of few measures not confounded by language/cultural translation) (Myers et al 2003, Landrigan and Goldman 2003)
Faroe Islands: dose-related, adverse associations with wide range of memory, attention, language and visual-spatial tests (even when controlled for PCBs) (Grandjean et al 1997)
6. NAS report: Toxicological Effects of Methylmercury Strong evidence for fetal neurotoxicity of methylmercury, even at low concentrations of exposure
All three studies credible, but not deterred by negative findings of Seychelles (50% statistical power for range of exposures in which effects occur)
NAS chose to base recommended safety threshold for methylmercury on Faroe Islands
(NRC 2000)
7. NAS recommendation Recommended to EPA choice of a benchmark cord blood mercury concentration of 58 mg/L
Level corresponds to doubling of clinically subnormal scores for Boston Naming Test
Faroes and New Zealand studies support conclusion that effects occur as low as 1 ppm hair Hg (5.8 mg/L cord blood) (Grandjean et al 1997; Kjellstrom et al 1986 and 1989)
Delays in brainstem auditory responses occur at much lower concentrations (Murata et al 2004)
8. Exposure to MeHg in US children 1999-2000 NHANES:
7.8% of women of childbearing age with total blood mercury concentration =5.8 mg/L (Mahaffey et al 2004)
Recent metaanalysis suggests cord/maternal blood mercury ratio = 1.7 (CI 1.0-3.4) (Stern and Smith 2004)
5.8/1.4 = 3.41 mg/L
15.7% of women of childbearing age with total blood mercury concentration =3.5 mg/L (Mahaffey et al 2004)
9. Previous Work Estimated IQ decrements resulting from children born with cord blood =5.8 mg/L in 2000 US birth cohort
Base case assumptions: 1.5 IQ point decrease/doubling, 1.7 cord/maternal blood concentration, 70% attributable to anthropogenic emissions
Used published percentiles of total mercury concentrations =3.5 mg/L (Mahaffey et al 2004)
10. Previous Work Converted to cost of loss economic productivity using preexisting relationships between loss in IQ and lost lifetime economic productivity
1.931% in men, 3.225% in women (Salkever 1995; Schwartz et al 1985)
Lifetime income of boy born in 2000 $1,032,002; lifetime income of girl $763,468 (Max et al 2002)
11. Results
12. Sensitivity Analysis Varied IQ impact from .85-2.4 points/doubling
Applied linear model used by NAS (.59-1.24 IQ points per mg/L increase)
Varied cord/maternal blood Hg ratio from 1-1.7
(Trasande et al EHP 2005)
13. What is Attributable to American Sources? In 1995, 158 tons of mercury were emitted to the atmosphere by American anthropogenic sources.
Fifty-two (33%) of those tons were deposited in the lower 48 states.
An additional 35 tons of mercury from the global reservoir were deposited in the United States.
Therefore, a total of 87 total tons of mercury were deposited in the United States in that year, of which 60% (52 of 87) would have been available to bioaccumulate in the marine and aquatic food chains and to enter American freshwater and saltwater fish. (U.S. EPA 2004)
Of the 10.4 billion pounds of edible fish supplied in the United States in 2002, 4.4 billion (42%) are imported from sources outside of the United States (National Marine Fisheries Service 2002).
In the remaining 58% of fish consumed in the United States, we calculate that 60% of the mercury content comes from American anthropogenic sources.
14. Imported Fish Mercury Content
158 tons of American emissions �
52 tons of American mercury deposited on American soil =
106 tons of American mercury available to contaminate imported fish
5,500 tons emitted globally �
87 tons deposited on American soil
= 5,413 tons of mercury from all sources to contaminate imported fish
15. American Fish Mercury Content
16. American Sources and Coal-Fired Power Plants
17. MR and the bell curve
18. Mental Retardation This analysis did not include the cost of cases of mental retardation that can result from loss of cognition, especially those children who are most highly exposed to methylmercury from anthropogenic sources.
To further assess the costs that may result from exposure of the developing brain to methylmercury, we estimated the burden and cost of mental retardation associated with anthropogenic methylmercury exposure in the 2000 U.S. birth cohort.
19. Methods Applied same model that we used to calculate costs of lost economic productivity in our previous analysis
Assumed that MeHg exposure is not correlated with native intelligence
Normally distributed with SD 15
Relied upon previously published per case cost estimates for MR (Honeycutt et al 2000)
After applying a 3% discount rate to extrapolate to the cost per case of mental retardation in 2000
Used a cost per case of $1,248,648 in 2000 dollars (excluding lost economic productivity)
20. Results At least 316,588 (7.8%) children are born in the U.S. with cord blood Hg levels >5.8 �g/L, and suffer loss of IQ ranging from 0.22-24.4 points (base case log model .76-3.21)
This IQ loss is associated with:
1566 (range 376 and 14293) cases of MR
Health care, special education and other costs amounting to $2.0 billion (range $.5-17.9) each year
This analysis suggests that 3.2% (range .8-29.2%) of MR is attributable to MeHg exposure from all anthropogenic emissions. (Trasande et al Am J Ind Med 2006)
21. American Sources and Coal-Fired Power Plants Mercury from American coal fired power plants is associated with 231 cases of MR each year, which cost $289 million (range 28-2109 cases, $35M-2.6B/yr).
This analysis suggests that .4% of cases of MR (range .06-4.3%) may be attributable to American coal-fired power plants.
22. Next Steps Comparing costs of mercury pollution control proposals
Existing protections under the Clean Air Act will limit mercury emissions from coal-fired power plants to five tons per year by 2008. (US EPA 2004)
Proposed �Clear Skies Initiative� would allow these releases to remain as high as twenty-six tons per year through 2010. (US EPA 2004)
Other legislative proposals: Sen. Jeffords (S. 150), Sen. Carper (S. 843 � 108th Congress)
23. Benefits of Clear Skies
24. Clean Air Act? Harvard/NESCAUM analysis only hypothesized economic benefits of Clear Skies
Did not include assumptions based on implementation of Clean Air Act, or alternative proposals
25. Preliminary C/E
26. Preliminary C/E
27. Thanks! Philippe Grandjean, Esben Budtz-Jorgensen, Karla Haynes, Danielle Laraque, Paul Leigh, Judith Palfrey and Clyde Schechter
Dorothy P. Rice and Wendy Max for their assistance with lifetime earnings estimates
Support: NIEHS Superfund Basic Research Program (PT42ES07384), PSR, Jenifer Altman Foundation