Download
1 / 28
280 likes | 398 Views
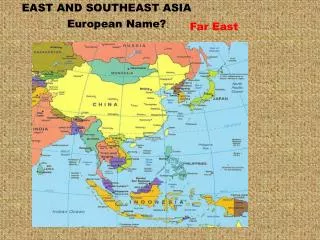
Freshwater Issues in South, Southeast and East Asia. Amy Duray EVPP 626, Spring 2009 April 6, 2009. Agenda. Water’s Use Regional Water Stress Primary Watersheds DPSIR (Overview) China India Mekong River Basin. Water is Essential. Consumption Sanitation Production Industrial

E N D
Freshwater Issues inSouth, Southeast and East Asia Amy Duray EVPP 626, Spring 2009 April 6, 2009
Agenda • Water’s Use • Regional Water Stress • Primary Watersheds • DPSIR (Overview) • China • India • Mekong River Basin
Water is Essential • Consumption • Sanitation • Production • Industrial • Agricultural • Power Generation • Transportation • Habitat • Drainage
Traditional Water Stress Indicators Source: SMAKHTIN, V.U., REVENGA, C., DÖLL, P. (2004) Taking into account environmental water requirements in global-scale water resources assessments. Research Report of the CGIAR Comprehensive Assessment of Water Management in Agriculture. No. 2, International Water Management Institute, Colombo, Sri Lanka, 24 pp. Accessed via: http://www.iwmi.cgiar.org/assessment/Publications/Maps_for_Research_Report_No2.htm
Water Stress Considering Ecosystem Requirements Source: SMAKHTIN, V.U., REVENGA, C., DÖLL, P. (2004) Taking into account environmental water requirements in global-scale water resources assessments. Research Report of the CGIAR Comprehensive Assessment of Water Management in Agriculture. No. 2, International Water Management Institute, Colombo, Sri Lanka, 24 pp. Accessed via: http://www.iwmi.cgiar.org/assessment/Publications/Maps_for_Research_Report_No2.htm
Primary Watersheds of South, Southeast, and East Asia 46 – Amur 74 – YaluJiang 54 – Hwang He (Yellow) 75 – Yangtze 73 – Xi Jiang (Pearl) 53 – Hong (Red) 64 – Mekong 58 – Kapuas 62 – Mahakam 49 – Chao Phrya 68 – Salween 57 – Irrawaddy 48 – Brahmaputra 51 – Ganges 56 – Indus 66 – Narmada 71 – Tapti 63 – Mahanadi 52 – Godavari 60 – Krishna Source: Ravenga et. al (1998) via Earthtrends Data Portal
DPSIR Framework(1 of 2) A. Drivers: • Deeply held (and often contrasting) beliefs and ethics regarding water management • Increasing Human populations, especially in historically occupied river basins and coastal enclaves • Increasing globalization in world economy B. Pressures: • Agricultural expansion and increased irrigation withdraws • Urbanization • Increasing groundwater extraction • Increasing industrial withdrawals • Increasing industrial (point source) pollution • Increasing agricultural (non-point source) pollution • Increasing demand for energy and hydropower • Dams and flow regime modification • Changing global climate, especially observed changes in seasonal precipitation and glacial ice • Increasing scarcity in certain regions due to either an increased supported population or decreasing hydrologic flow
DPSIR Framework(2 of 2) C. State-and-Trends: • Increasing sea temperatures (effects water density, which effects sea levels, salt water intrusion into estuarine areas AND effects storm frequencies along coastal regions) • Changes in precipitation/Increasing variability especially with respect to monsoons. (UNEP, 2007) • Increasing personal access to water (in aggregate, per UN) • Increasing contamination in many river basins (Ravenga et. al, 1998) D. Impacts: • Increasing time/labor to access water supplies in some locations (UNEP, 2007) • Decreased total flow, especially in downstream communities (Ravenga et. al, 1998) • Increasing use of water systems to carry away wastes deposited there by sanitation systems (or unsanitary wastes) • Decreasing habitat quality for aquatic/riparian flora and fauna • Decreasing freshwater diversity D. Responses: • Increasing water diversion for reservoirs, flood control, and hydropower • Development of water economies (e.g. entrepreneurial or mandated trucking of potable waters in underserved areas) • Development of Polluter-Pays policies (especially in East Asian Countries – GEO-4 p. 219) • Development of demand-side water management strategies (China/Mongolia Amur region – GEO-4 p. 219) • Improvements in water use efficiency, esp. for irrigation in agriculture and industrial uses. • Market-based incentives for efficiency increases and utility upgrades • Bi-lateral and Multi-lateral treaties for water management and hydropower • Proliferation of “soft-path” water purification, collection, and distribution methods (Gleick, 1993)
China(1 of 4) • 4th Largest national freshwater resources • North = Scarcity, South = Quality • Drivers: • Population Growth, Development, industrialization • Concentration of population in historic river basins • Communist Party structure and organizational culture • Video: China’s Water Woes (NY Times)
Yellow River Source: Ravenga et. al (1998) via Earthtrends Data Portal
Yangtze River Source: Ravenga et. al (1998) via Earthtrends Data Portal
China(2 of 4) Pressures: Pollution Pressures: Scarcity Agricultural withdraws constitute 66% of water use in China Waste/Inefficiencies in Water use and distribution Increasing affluence of Chinese population (esp. in cities) means that water consumptions patterns are becoming more like European and American users – more and longer showers, household washing machines and dishwashers. Millennia of hydrologic alteration of the Yellow River and especially hydropower construction under Mao Desertification-induced siltation in the Yellow River basin • Increasing agricultural inputs of fertilizer and pesticide • Increasing urbanization means increasing storm water inputs, and larger pollutant load • Industrial discharges • Increasing production of hazardous wastes, with poor disposal/sequestration protocols • Increased damming for hydropower leading to reduced flow volume • Increasing irrigation withdraws leading to reduced flow volume • Lack of adequate enforcement of National environmental policies regarding waste water
China(3 of 4) State-and-Trends: Pollution State and Trends: Scarcity See Picture – NY Times - Where Water is Scarce Two-thirds of China’s 660 cities have less water than they need 1 in 6 cities have “severe” water shortages Several cities in the North near Beijing and Tianjin could run out of water in 5-7 years. Urban water consumption 2004-2005 grew by 6.6% Groundwater provides 70% of drinking water • Aquifers below 90% of China’s cities are polluted • The Chinese Government has reported that 30% of river water throughout the country is unfit for use in agriculture or industry • 700 Million people drink water contaminated with animal and human wastes
China(4 of 4) Impacts: Pollution Impacts: Scarcity Extreme groundwater/aquifer depletion (See Picture – NY Times - Where Water is Scarce) Yellow River Delta often dry, leading to habitat destruction, lack of land creation Seawater intrusion into estuaries Subsidence • World Bank links water contamination as the leading cause of death among children under age 5. • 11% of gastrointestinal cancers in China are linked to water pollutants • Widespread lotic habitat destruction Response: Pollution Response: Scarcity • 1987 – Yellow River Water Distribution Formula (Ma, 2007) • Reforestation efforts on the Loess Plateau (Ma, 2007) • South to North Water Diversion Project • Green GDP
South-to-North Water Diversion Project NY Times: Sending Water North From: NY Times via Yale Environment 360
India(1 of 4) • NY Times India’s Water Woes: Part I and Part II • Drivers: • Population Growth, Development, industrialization • Concentration of population in historic river basins • Religious practices
India(2 of 4) Pressures: Pollution Pressures: Scarcity Increasing populations and urbanization Declining glacial melt during the dry season Increasing interannual variability of precipitation Increasing extractions for agriculture and hydropower • Increasing Population and Urbanization • Lack of adequate sanitation infrastructure • Decreasing water flow in watersheds • Uneven enforcement of industrial environmental release standards
India(3 of 4) State-and-Trends: Pollution State and Trends: Scarcity In India, “gross per capita water availability” will decline from around 1,820 cubic meters a year to as low as around 1,140 cubic meters a year in 2050 The current trends in glacial melt suggest that the Ganges, Indus, Brahmaputra and other rivers that cross the northern Indian plain may become seasonal rivers in the near future as a consequence of climate change. • 75-80% of water pollution in the Ganges comes from raw sewage – approx. 3 Billion L of waste every day • 80% of India’s urban waste drains into rivers • Fecal coliform bacteria in Ganges River (as measured near Veranasi) 3000% higher than the level considered safe for bathing.
India(4 of 4) Impacts: Pollution Impacts: Scarcity Food shortages in India and Bangladesh from faltering grain production Increasing groundwater withdrawls Land degradation • Human health impacts • Species loss (i.e. River Dolphins) Response: Pollution Response: Scarcity • Green Increasing sewage treatment capacity ($500M spent to date) • Restoring sewage infrastructure (additional $500M planned) • Despite impacts already observed, plans to increase diversions are still being developed
Mekong River Source: Ravenga et. al (1998) via Earthtrends Data Portal
Mekong River • True international river – Six riparian states • 3rd highest River in term of Biological Diversity (behind Amazon and Congo) • 72 million inhabitants of the basin (2005 – up from 63 million in 1995) • Growth rates slowing in some areas (China, Thailand, Myanmar) but rising in others (Cambodia, Laos, Vietnam) – expected positive growth through 2050.
Mekong River Pressures: • Navigation – plans to dredge and blast to increase carrying capacity • Hydropower: • China planning 8 hydropower dams on upper reaches (2 built, 2 under construction) • Laos plans 6 dams on Laotian tributaries • Fish Exploitation • Patchy international coordination
Mekong River State-and-Trends: • Extremely abundant resources – 1700 fish species know, several endangered • Largely natural flow regime supports this level of diversity
Mekong River Impacts: • Impacts to human nutrition: • 80% of dietary protein provided by fish of Mekong • Kai, a high-protein littoral plant, supplies additional protein to diets • Damming disrupts the natural flood cycle • Impacting agriculture downstream • Impacting aquatic food cycle • Decreased flow expected (up to 23% decline)
Response • Mekong River Commission • Basin-wide impact assessment requirements • Increasing community-driven activism