Download
1 / 14
140 likes | 432 Views
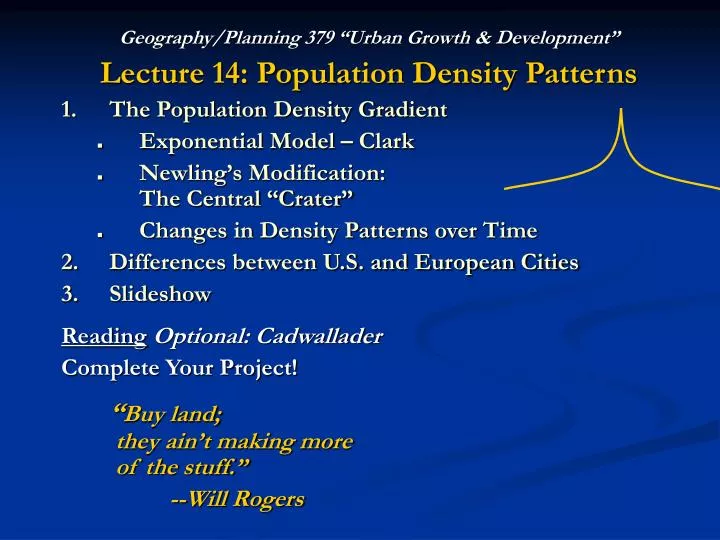
Geography/Planning 379 “Urban Growth & Development” Lecture 14: Population Density Patterns The Population Density Gradient Exponential Model – Clark Newling’s Modification: The Central “Crater” Changes in Density Patterns over Time Differences between U.S. and European Cities Slideshow

E N D
Geography/Planning 379 “Urban Growth & Development” Lecture 14: Population Density Patterns The Population Density Gradient Exponential Model – Clark Newling’s Modification: The Central “Crater” Changes in Density Patterns over Time Differences between U.S. and European Cities Slideshow ReadingOptional: Cadwallader Complete Your Project! “Buy land; they ain’t making more of the stuff.” --Will Rogers
1. The Population Density Gradient Exponential Model – Clark • “Population Density”: Measured as people per square mile or per square kilometer or per acre or per hectare • “Population Density Gradient”: How does population density change with increasing distance, x, from the center? • First major study of this by Colin Clark (1951) “Urban Population Densities” Journal of the Royal Statistical Society
1. The Population Density Gradient Exponential Model – Clark • Like Homer Hoyt’s methodology for housing values, he looked at actual data for a sample of many major cities around the world • Unlike Hoyt, though, he tried to statistically fit functions or curves to the data D(x) Density at distance x x, distance from center
1. The Population Density GradientExponential Model – Clark (Continued) • What’s D0 ? • It’s the Central Density, the value of D(x) when x=0. • What’s any number raised to the zero power? • So: D(0) = D0 e 0 = D0 x 1 = D0 • Where’s that on the graph? D(x) Density at distance x D(x) = D0 e –b x D0 b = 0 b = 0.1 b = 0.2 b = 0.3 b = 0.4 x, distance from center
Every urban area has a unique pair of D0 and b parameter values – which can be found by fitting a curve to actual census population data for, say, census tracts at different distances from the center D(x) Density at distance x D(x) = D0 e –b x D0 b = 0 b = 0.1 b = 0.2 This one is the most “bent”; it has the highest b parameter value b = 0.3 b = 0.4 x, distance from center What’s b? It’s a parameter that controls how quickly density falls off with increasing distance from the center. What if b = 0? … But what’s e?
“e” • e is just a number • It’s the base of the natural logarithms • It’s approximately 2.7, but it’s an irrational number… • More accurately it equals: 2.71828182845904523536028747135266249775724709...
e gives us the rate of continuous compounding • Suppose you put $100 in a bank account that pays 5% interest • How much money will you have at the end of a year? • That depends on how the interest is compounded! e = limn→∞(1 + 1/n)n Simple interest: $100 + .05 x $100 = $105.00 Semi-annual: $100 + .05/2 x $100 = $102.50 $102.50 + .05/2 x $102.50 = $105.06 Quarterly: $100 (1 + .05/4)4 = $105.09 Monthly: $100 (1 + .05/12)12 = $105.12 Daily: $105.13 ($105.12675) Continuous: 100 x e.05 = $105.13 ($105.1271)
1. The Population Density Gradient Exponential Model – Clark (Continued) B(t) = B0 e itPositive exponential; Bank Accounts, Population Growth • But there’s a problem with this model: What happens near the center? • How many people live there? • What kind of land use is actually found in the CBD? • Negative exponential good for DAYTIME densities D(x) = D0 e –b xNegative exponential;Urban Density Gradients
Newling’s Modification: The Central “Crater” and Density “Rims” • Newling in 1969 proposed a modification of the basic negative exponential model to better represent night-time (or more normal) population densities • A “Central Crater Effect” and a “Density Rim” that show how densities are lower in the CBD due to the substitution of commercial for residential land uses What would this look like in 3-D? [A Volcano!] D(x) Density at distance x Outlying “Density Rim” x, distance from center
How do density patterns change over time? • 19th century U.S. cities were more compact and densely populated • Central densities were higher previously than they are now • Cities have sprawled out, and their density gradients have flattened • Both D0 and b have decreased over time D(x) Density at distance x 1875 1925 2005 x, distance from center
Differences between U.S. and European Cities • Central densities have not declined as suburbs have been added; may actually have increased • D0parameter values: Europe → or ↑ USA: ↓ • The rate of decline with distance has remained constant • bparameter values: Europe → USA: ↓ • Edges better defined: Cities stayed more compact than in USA
Differences between U.S. and European Cities Reasons for these differences? • Stronger planning and zoning in Europe • Plenty of cheap, developable land around edges of U.S. cities, not in Europe • Less dependence on private automobiles in Europe; better public transport • Downtown shopping areas have been kept healthy in Europe with government help • Less overall population growth
Slideshow Density Patterns in U.S. and European Cities
Pop Quiz Name __________ Name the Roman-Empire-Era European city shown in the slideshow that was one of the earliest examples of a rectangular street grid plan. A. Aix-en-Provence, France B. Lisbon, Portugal C. Amsterdam, The Netherlands D. Stuttgart, Germany