Download
1 / 27
270 likes | 413 Views
CONSERVATON BIOLOGY Lecture14 – Spring 2013 Althoff. Assessment & Monitoring Part II. FQI. Assessment & Monitoring: PLANT COMMUNITIES. Metrics already mentioned (i.e,. species richness, Simpson’s index, Shannon-Weiner, evenness, etc.) often used for assessment and monitoring.

E N D
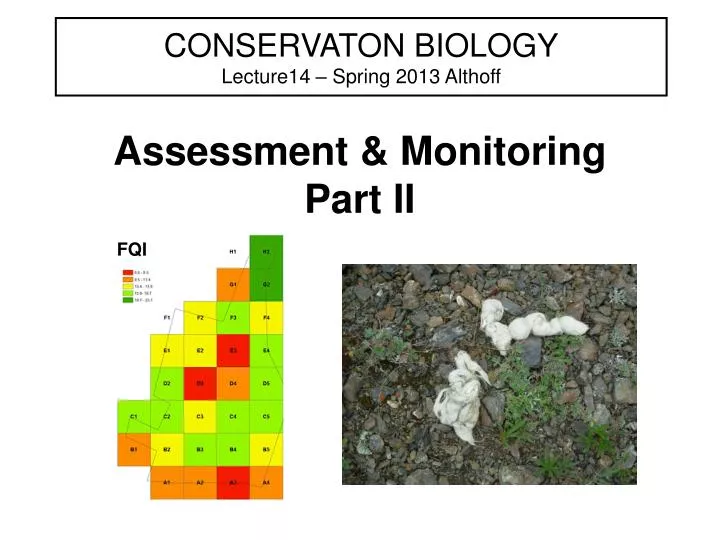
CONSERVATON BIOLOGYLecture14 – Spring 2013 Althoff Assessment & Monitoring Part II FQI
Assessment & Monitoring: PLANT COMMUNITIES • Metrics already mentioned (i.e,. species richness, Simpson’s index, Shannon-Weiner, evenness, etc.) often used for assessment and monitoring. • Data can be obtained from ________________ methods such as line transects (point intercept, line-intercept, quadrats, etc.) . • For “coarse” assessments, aerial and satellite photos are now becoming more and more available with increased resolution. • All these methods are considered objective….and fairly easily to implement
PLANT COMMUNITIES…con’t • The challenge is often to interpret those metrics. Generally, need to have __________ communities (areas) surveyed…then evaluate which of those communities (areas) might be of the greatest conservation “value”/importance with respect to maintaining biodiversity. • Swink and Wilhelm (1979) developed the _____________________ (FQI) to taken into account some EXPERT opinion on the rarity/uniqueness of individual species.
FQI Swink, F. and G. Wilhelm. 1979. Plants of the Chicago region. 4th edition. Academy of Science Press, Indianapolis, Indiana. • Also known sometimes as ______ = Floristic Quality Assessment Index, which reflects the “assessing” part of a management effort • Has been modified somewhat over time, but for the most part still calculated the same way (see next slide). 1) requires “______” opinion about a ______ _____________________ 2) requires documenting its ____________
FQI…has been applied to many differentdifferent types of plant communities • Grasslands / prairies • Marshes • Wetlands/Restored wetlands • Woodlands
FQI…con’t • Index based upon the degree of “____________ ___________”… • …which depends on the ___________ a certain plant has toward a habitat type • Expert opinion, therefore, is required. For some species we have a good understanding of “what” makes it so habitat (microhabitat) specific. For other species we know that it is rare but not necessarily what it is so limited in distribution. Either way, experts have (or will) ______ all the vascular plants in a region. Thus, some degree of _____________ !!
FQI…con’t Plants with wide range of ecological tolerances. Often opportunistic invaders Widespread taxa that are not typical of (or only marginally typical of) a particularcommunity) Plants with an intermediate range of ecological tolerances that typify a stable phase of some native community but persist under some disturbance Plants with a narrow range of ecological tolerances that typify a stable or near “climax” community Plants with a narrow range of ecological tolerances That exhibit relatively high degrees of fidelity to a narrow range of habitat requirements • The ranking results in what are termed Coefficients of Conservatism = _____
FQI formula FQI = • mean of C (take the average of all the C values for all plant species found) • N = number of plant species found • Higher the FQI, the more _________________ for that area/community
FQI example FQI = mean of C * N C Water lobelia 10 Dwarf water-milfoil 10 Pipewort 9 Variable-leaf pondweed 7 Water smartweed 5 Quillwort 8 N = C = FQI = 8.17 * 6 =
Things to consider using FQI • Most plant species are evaluated regionally. What might be a rare plant in one state would be considered no-so-rare in another. Therefore, the same species might have _________ values—depending on region. • _______________ can be based on 1) the researcher’s own experience/knowledge, 2) published reports and gray literature, and 3) unpublished reports/listing
Some reasons FQI has been adopted… • Ability to assess “_____” plant communities (i.e., several wetland sites or several prairie tracts) • Provides a standard, unbiased (?), _________ ________ that holds promise for monitoring ________ over time for a region • Compared to biological indices that require extensive laboratory processing, FQI can mainly be accomplished ______________ (but this is tech/observer dependend to some degree) • Metric incorporates “_________” C of C values • Can use FQI for land mgmt., restoration, and _________________________ of natural areas.
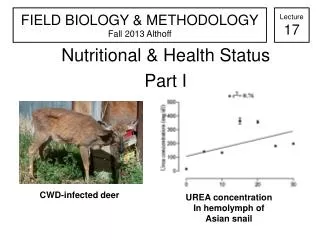
Ohio’s FQI vs. Relative Disturbance Rank (source: Ohio EPA) Trend: less disturbed communities tend to have ________FQI scores
Non-invasive and/or “New” (last 10-15 years) approaches for monitoring… • Using ______ –long term (hundreds to thousands of years or more). One source: guano piles • Using _______________ • Using _______________ (mammals, of course) • Using _______________ • Using _______________ (generally mammals) • Using _______________ • Other……
Droppings / Scats • Can _______ inspect to determine species (i.e., its presence) • Can process/analyze DNA for a species to determine: a) number of individuals b) sex ratios c) degree of relatedness • Can determine foods used
Droppings / Scats…examples • Wolverines • Horseshoe bats • Elephants • Warthogs • Badgers • Otters • Cougars • Gray squirrels • Etc.
Hair • Can __________ inspect to determine species (i.e., its presence) in some instances • Can process/analyze DNA for a species to determine: a) number of individuals b) sex ratios c) degree of relatedness
Hair…examples • Many species of elusive carnivores • Ungulates • Lagamorphs • Etc.
Trip Cameras • Many species of elusive carnivores • Ungulates • Etc.
Long-Term Protocols • Many state and federal agencies are implementing these for variety of taxa…if not already in place • Department of Defense (DOD) installations are using these to monitor “ecosystem level” management needs (ITAM, LCTA RTLA) • Tribal Authorities using • ______ = rapid bioassessment protocols developed for some ecosystems (ex. streams = stream quality) . Combo of biotic + abiotic components
Reference…based on approach National Park Service (NPS) has implemented Oakley, K. L., L.P. Thomas, and S. G. Fancy. 2003. Guidelines for long-term monitoring protocols. Wildlife Society Bulletin 31(4):1000- 1003. • NPS had to consider planning and designing for >270 national parks • Consulted scientist within the NPS system and US Geological Survey
Long-Term Protocols…. • are a key component of quality assurance for monitoring programs to ensure that data meet a) b) • are necessary for the program to be ______ so data stands up to _____________ • Necessary to detect changes over _____ and with changes in _____________ • Allow _______________ of data among places and agencies
Long-Term Protocols…. • Designing a monitoring project has been likened to getting a _________: “you want to get it right the first time because making major changes later can be messy and painful” Oakley et al. (2003) • IF protocols/planning incorporates a large up front investment in… a) defining objectives b) optimizing sampling designs, and c) determining how results/data will be used …then the monitoring program is more likely to ____________
Effective protocols… • Provide _____ than detailed descriptions of field methodology • Have _______________ procedures for collecting, managing, and analyzing data are critical • Are extensively tested and evaluated for effectiveness before they are implemented for expected long-term monitoring • Include _____________ of protocols • Include documentation during the ____________ process as well as what becomes the final protocol(s) is recommended (including comments from reviewers and author’s responses)
Expect and/or consider…. • Some _________ will occur to these protocols because a) field methodology will improve/change b) data analysis methods will improve/change c) reporting methods will improve/change • To develop SOPs (_____________________ ____________ ) with a section in the documentation that provides supporting materials for establishing those SOPs • Multiple agency and ecological region adoption of protocols
3 major sections to a monitoring protocol Narrative 1 SOPs 2 Supplementary Materials 3
Recommended content of narrative section 1 • Background and objectives • Sampling design • Field Methods • Data handling, analysis, and reporting • Personnel requirements and training • Operational requirements • References
Example SOP section …for bird monitoring 2 • Preparations and Equipment Setup prior to field season • Training observers • Using GPS • Establishing and marking sampling plots • Conducting the variable circular plot count • Documenting habitat variables • Data Management • Data Analysis • Reporting • Procedure & equipment storage after field season • Revising the protocol