Download
1 / 18
180 likes | 308 Views
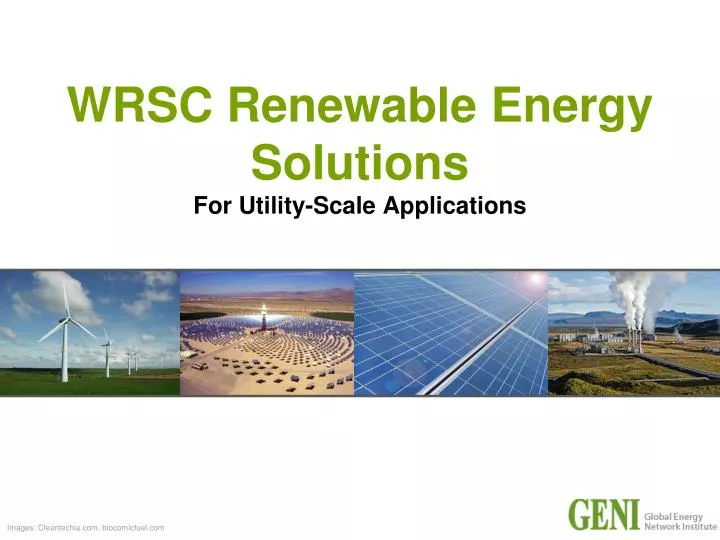
WRSC Renewable Energy Solutions For Utility-Scale Applications. Images: Cleantechia.com, biocomicfuel.com. METHODOLOGY. METRICS For each Renewable Option, the following factors were compiled and analyzed: The factors highlighted in grey are evaluated in the following report.

E N D
WRSC Renewable Energy SolutionsFor Utility-Scale Applications Images: Cleantechia.com, biocomicfuel.com
METHODOLOGY • METRICS • For each Renewable Option, the following factors were compiled and analyzed: • The factors highlighted in grey are evaluated in the following report. All sources listed on accompanying spreadsheet
RENEWABLE ENERGY SOLUTIONS Concentrating solar power (CSP) technologies use mirrors to reflect and concentrate sunlight onto receivers that collect the solar energy and convert it to heat. This thermal energy can then be used to produce electricity via a steam turbine or heat engine driving a generator. The following four technologies are forms of CSP:
CAPACITY • To measure the productivity of a renewable energy option, we use its Capacity Factor (CF), which is the amount of energy a power station generates over time (usually a year) compared to what it could have produced if it had been running at full power for the whole period. Capacity Factor is important not only because it reflects the performance of a power station, but also because a higher capacity factor represents a more stable power grid. Capacity Factor Renewable Energy Options
CAPACITY INSIGHTS Nuclear .95 - .98 Coal .65 - .75 Geothermal Energy’s high capacity factor is due to the nature of its source, the Earth’s heat, which is independent of daily and seasonal weather fluctuations, allowing it to run at full power most of the time. It’s ability to match peak loads, makes it a promising option to replace dirty coal in the energy mix. Similarly, with a steady supply, Biomass/gas plants can run at full power around the clock. Of the four CSP based Solutions, Parabolic Reflector Technologies - Linear Fresnel and Parabolic Trough have significantly greater productivity and grid stability than the other two options. It should be noted, however, that Power Tower technologies, have a projected Capacity Factor of .73. Although development is less advanced than Parabolic Reflector based systems, they offer higher efficiency and better energy storage capability, which is required for around-the-clock dispatchability (NREL).
RELIABILITY • An Availability Factor (AF) is used to determine how reliable or constant an energy source is, especially during peak loads. Note, this is different from capacity factor which measures what percentage of the time the plant is able to run at full capacity. When looking at the AF it is important not only to compare across renewable sources but also to conventional fossil fuel based sources. Availability Factor 1 (Low) - 5 (High) Renewable Energy Options
RELIABILITY INSIGHTS Coal .65 - .90 Nuclear .70 - .90 (depending on how new the plant is) Geothermal is considered the most reliable source due to its ability to generate a steady stream of energy 24/7. Although Solar is an intermittent resource, concentrated solar energy can be stored at high temperatures using molten salts. Salts are an effective storage medium because they are low-cost, have a high specific heat capacity and can deliver heat at temperatures compatible with conventional power systems. Wind and Biomass/Biogas are less reliable since their energy source is more variable.
INSIGHTS CONT… Wood comprises the majority of the energy source. Therefore, logging regulations and transportation costs vary greatly depending on the location of the plant. Wind, also an intermittent source, cannot guarantee constant availability. And without storage, must be used as soon as it is produced, or immediately transported to where it can be used, through transmission lines. Improved reliability is possible with a widely geographically dispersed set of wind farms, raising its availability factor to .85. Image: http://www.dasgelbeforum.de.org/
TECHNOLOGY RISK • Technology Risk is the degree of uncertainty associated with technology performing according to its planned or desired functionality. It is important when considering renewable energy options because performance in lab or pilot studies can vary greatly from installed & operational performance. Technology Risk Ratings 1 (High Risk) - 5 (Low Risk) Renewable Energy Options
TECHNOLOGY RISK INSIGHTS • Trough technology is further advanced than tower, fresnel and dish technology, with 354 MW of commercial generation in operation in US. It is fully mature and there is low technical and financial risk in developing near-term plants. • Solar PV, Wind & Biomass/gas are all well established technologies with proven operational performance. • Linear Fresnel, while the oldest CSP technology, suffers from a lack of reference plants already built, as well as up and running. • Geothermal energy provided 16,010 GWh of electricity in 2005. However, larger scale use is limited unless permeability can be increased. The DOE has determined that the most critical near-term goal is the successful demonstration of Enhanced Geothermal Systems (EGS) and has identified 2015 as the key decision point for determining if it is technically feasible. • Tower technology has been successfully demonstrated with a conceptual and pilot plants (Solar One and Solar Two) but has not been proven in a large commercial application. • Dish Engine systems face high technology development risk. The DOE is currently working with companies to design, develop, install, and test pre-production prototype 25-kilowatt systems.
ENVIRONMENTAL RISK • Environmental Risks associated with utility-scale Renewable Energy Installations can be very high and vary greatly on a site-by-site basis. Mitigating these risks can delay projects for years and cost millions in legal fees. Additionally, over the life of a plant the laws and regulations governing the environmental impacts are likely to change. Environmental Risk Ratings 1 (High Risk) - 5 (Low Risk) Renewable Energy Options
ENVIRONMENTALRISK INSIGHTS • Wind carries low environmental risk because land is minimally effected and can still be used for agriculture/livestock. Additionally, it is well established and environmental risk assessments are easily carried out. • Linear Fresnel installations use less than 4 acres/MW, making the land requirement less than trough plants because more surface area can be covered with mirrors. • Solar PV installations use 4 acres/MW, and have minor panel disposal issues. • Biogas generation typically improves air quality, since methane from landfills is used as an energy source instead of being released into the atmosphere. • Geothermal energy has low environmental risk and impact. When used with a closed-loop binary power plant, geothermal systems emit zero greenhouse gas emissions and have a near zero environmental risk or impact. Typically parabolic trough power plants use about 8-10 acres/MW, Tower and Dish Engine use 10-15 acres/MW. Installations are usually are in remote desert areas, however unique plants and animals have to be protected costing time and money. Biomass power raises the most environmental issues.. Combustion of biomass and biomass-derived fuels produces air pollution; beyond this, there are concerns about the impacts of using land to grow energy crops that could be used for food.
MARGINAL COST ESTIMATES • One of the most important factors in evaluating how competitive renewable energy options are with traditional fossil fuels is the Levelized Cost of Energy (LCOE), or constant price per unit of energy that causes the utility company’s investment to break even. The LCOE equation evaluates the life-cycle energy cost and production of a power plant, allowing alternative renewable energy options to be compared. .30 - .40 Marginal Cost ($/kWh) .06 - .10 .08 - .10 .07 .05 - .08 .04 - .06 .06 .01 - .02 Renewable Energy Options
MARGINAL COST INSIGHTS • Even with wind generation’s high upfront costs, low maintenance and low operational costs drive the LCOE down. • With advances in technology, Power Towers are expected to be the most economical solar energy technology with estimates of less than 4 cents/kWh. • The other 3 CSP technologies range between $0.06 - $0.10/kWh. Prices are expected to drop as more plants become operational and efficiencies are gained from new technologies. • Biomass prices depend on the price of its source, which can vary widely at times. Utility-Scale Solar PV installation have the highest LCOE, which is greatly influenced by the plants capacity factor. By raising the capacity factor, the LCOE can decrease substantially, even up to four times lower.
AVAILABLE INCENTIVES Federal/State policy and tax incentives greatly influence utility investment in renewables and can help them offset high initial costs. The availability and degree of incentives for renewable energy options varies across industries and states. Incentives Rating 1 (Low) - 5 (High) Renewable Energy Options
INCENTIVES INSIGHTS Wind and Solar PV receive a high degree of tax and policy incentives. Large Federal tax incentives and new state policies that expedite permitting, environmental reviews and approval processes for new Wind Farms and Solar PV installations have enabled both industries to flourish. c • Concentrated Solar Technology is also receiving a relatively high degree of support. The same federal tax incentives are available to utilities looking to utilize these renewable energy supplies and, in California, efforts are being made to streamline the approval processes for new CSP plants as well. • New National and DOE incentives are aimed at expanding the scope of Biomass/Biogas to include the development of other advanced biofuels that will contribute to the requirements of the Renewable Fuels Standard (RFS). The largest problem facing the geothermal industry is the lack of a Federal policy promoting geothermal development. The economic viability of most geothermal electricity production projects continues to be dependent on the financial support created by state energy policy.
CASE STUDIES Utility-Scale Case Studies (OSTI, NREL): http://www.osti.gov/accomplishments/NRELprofiles.html