Download
1 / 18
180 likes | 309 Views
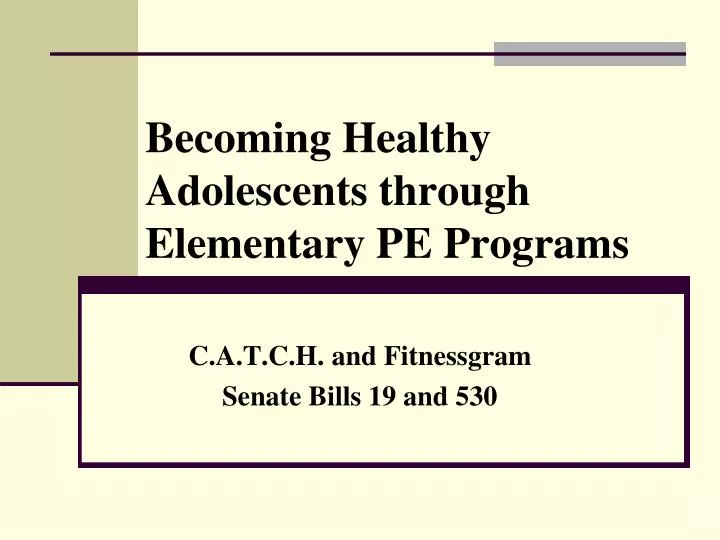
Becoming Healthy Adolescents through Elementary PE Programs. C.A.T.C.H. and Fitnessgram Senate Bills 19 and 530. As a State and a Nation. Upwards of one third of the adult population in the United States is now considered to be overweight and/or obese.

E N D
Becoming Healthy Adolescents through Elementary PE Programs C.A.T.C.H. and Fitnessgram Senate Bills 19 and 530
As a State and a Nation • Upwards of one third of the adult population in the United States is now considered to be overweight and/or obese. • By requiring 135 minutes of weekly physical activity and setting dietary guidelines in our cafeterias, every school in Texas is helping young children to make healthier lifestyle choices. • C-FBISD has implemented C.A.T.C.H. as part of this ongoing fight against obesity.
What is C.A.T.C.H.? • C.A.T.C.H. stands for Coordinated Approach To Child Health • formerly known as the Child and Adolescent Trial for Cardiovascular Health • It is a four part Coordinated School Health Program designed to prevent sedentary behavior, poor dietary choices, and tobacco use through changes beginning at the elementary school level • Every school in Texas, grades K – 8, must demonstrate that they have an ongoing Coordinated School Health Plan in place as of the 2007- 2008 school year
C.A.T.C.H. Components It’s All About Healthier Kids Classroom Curriculum PhysicalEducation Food Service Family
The Four Components of C.A.T.C.H. • 50–75% of Physical Education class content will be MVPA (moderate to vigorous physical activity). • The PTA, counselor, nurse, food service personnel and physical education teachers hold informative meetings for parents, such as family health nights and morning meetings for parents. • The food service department meets all state guidelines for healthier foods by setting serving standards and reducing the fat and calorie content in food served. • The classroom teacher’s role is two fold: • Teach minimum of 8 – 10 health lessons a year guiding students toward a healthier lifestyle. • Provide a daily structured recess in order to meet/complete the weekly state mandated minutes from SB19.
Portion Sizes and Obesity Rates • The following charts will demonstrate not only how portion sizes have changed in the US but why obesity has become a national epidemic.
How Portion Sizes in the U.S. have Changed In Recent Years Putnam J. U.S. Food Supply Providing More Food and Calories. CNI. 2000;4-5.
Obesity –BRFSS, 1991Trends Among U.S. Adults (*BMI 30, or ~ 30 lbs overweight for 5’4” person) No Data <10% 10%–14% 15%–19% 20%–24% 25%–29% ≥30%
Obesity –BRFSS, 1994Trends Among U.S. Adults (*BMI 30, or ~ 30 lbs overweight for 5’4” person) No Data <10% 10%–14% 15%–19% 20%–24% 25%–29% ≥30%
Obesity –BRFSS, 1999Trends Among U.S. Adults (*BMI 30, or ~ 30 lbs overweight for 5’4” person) No Data <10% 10%–14% 15%–19% 20%–24% 25%–29% ≥30%
Obesity –BRFSS, 2002Trends Among U.S. Adults (*BMI 30, or ~ 30 lbs overweight for 5’4” person) No Data <10% 10%–14% 15%–19% 20%–24% 25%–29% ≥30%
Obesity –BRFSS, 2007Trends Among U.S. Adults (*BMI 30, or ~ 30 lbs overweight for 5’4” person) No Data <10% 10%–14% 15%–19% 20%–24% 25%–29% ≥30%
Fitnessgram • As of the 2007 – 2008 school year, Texas state law mandates that all students Grade 3 – 12 be evaluated annually on a battery of six fitness assessments: • Aerobic Capacity • PACER • Strength and Endurance • curl ups and 90° push ups • Flexibility • trunk lift and sit ‘n reach • Body Composition • BMI through height and weight
Fitnessgram Results • Generally speaking, across the state of Texas, the results to date have been as predicted. A higher number of younger students achieved their personal Healthy Fitness Zone (HFZ) in all categories. • At 3rd grade, an average of 32% of girls and 24 % of boys achieve the HFZ. • By 7th grade, these numbers drop to 21% and 17% respectively. • By 12th grade less than 10% of all students are able to meet these basic health standards.
Comparisons of C-FBISD Students Achieving Healthy Fitness Zones by Assessment, Grades 3 - 12
All students will continue to learn and practice the correct techniques and strategies for all Fitnessgram tests. Healthy lifestyle choices and habits will be practiced throughout the students’ school years. Good health and nutrition lessons, appropriate food selections and choices in C-FBISD cafeterias, adult and family education, and promotion of daily exercise, both at home and through CATCH and PE at school, will enable students to become healthier adults. Ongoing Goals for Upcoming Years