Download
1 / 48
480 likes | 591 Views
How Can We Build Healthy & Active Communities?. James Sallis, PhD University of California, San Diego http://sallis.ucsd.edu For PAPH in Aruba June 14, 2012. Maintaining & Building Activity-Friendly Places in Aruba. S leep L eisure O ccupation T ransportation H ousehold.

E N D
How Can We Build Healthy & Active Communities? James Sallis, PhD University of California, San Diego http://sallis.ucsd.edu For PAPH in Aruba June 14, 2012
Sleep Leisure Occupation Transportation Household SLOTH Model of Physical Activity
What is being done to improve PA? Minor investment in programs Guided by theories that emphasize psychological & social influences Primary goals are education and behavior change skills training targeting individuals Fragmented, poorly coordinated, poorly funded approaches
Psychosocial Models of Health Behavior Social/Cultural Individual Biological Psychological Skills
Will individual interventions ever be sufficient? • Interventions based on psychosocial theories can be effective • But not sufficient • Reach is limited • Effects are modest • Maintenance is rare • Programs are not designed to change the root causes of current behavioral patterns
An Ecological Model of Health Behavior Policy Context Physical Environment Social/Cultural Individual Biological Psychological Behavioral Skills
Leisure Occupation Transportation Household Parks, health clubs, sidewalks Workplace Streets, bike facilities Home Places for Physical Activity
Elements of An Active Living Community Comm Design Destinations Home Transportation School & Preschool Park & Rec
The Neighborhood Quality of Life (NQLS) Study: The Link Between Neighborhood Design and Physical Activity James Sallis Brian Saelens Lawrence Frank And team Results published March 2009 in Social Science and Medicine
NQLS Neighborhood Categories Walkability High Low 4 per city 4 per city Low Socioeconomic Status High 4 per city 4 per city
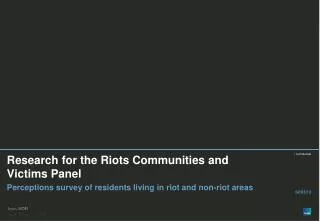
Accelerometer-based MVPA Min/day in Walkability-by-Income Quadrants Walkability: p =.0002 Income: p =.36 Walkability X Income: p =.57 * Adjusted for neighborhood clustering, gender, age, education, ethnicity, # motor vehicles/adult in household, site, marital status, number of people in household, and length of time at current address.
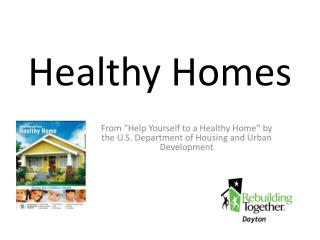
Percent Overweight or Obese (BMI>25) in Walkability-by-Income Quadrants Walkability: p =.007 Income: p =.081 Walkability X Income: p =.26 * Adjusted for neighborhood clustering, gender, age, education, ethnicity, # motor vehicles/adult in household, site, marital status, number of people in household, and length of time at current address.
Multiple Pathways from Land Use to Health: Walkability Associations With Active Transportation, Body Mass Index, and Air Quality.Frank et al. JAPA 2007 • 5% increase in walkability associated with: • 32% increase in walking for transport • ¼ point decrease in BMI (about 1.25 pounds) • 6.5% decrease in vehicle miles traveled • 5.6% decrease in oxides of nitrogen (NOx) grams • 5.5% decrease in volatile organic compounds (VOC) grams • County government is acting on results
Accelerometer-based MVPA Min/day in Walkability-by-Income Quadrants Walkability: F=13.74; p =.000 Income: F=2.59; p =.108 Walkability X Income: F=.001; p =.981 * Adjusted for gender and age
Walkable neighborhoods encourage more walking in older adults Older women who live within walking distance of trails, parks or stores recorded significantly higher pedometer readings than women who did not. The more destinations that were close by, the more they walked. Photo: Michael Ronkin, ODOT King, W., Am. J. of Public Health 2003
Atlanta, USA Ghent, Belgium We can learn from international studies
Multiple Environmental Factors Are Needed to Support Physical Activity: An 11-Country Study of Neighborhood Environments James F. Sallis, USA Heather Bowles, Australia Barbara E. Ainsworth, USA Adrian Bauman, Australia Et al Am J Prev Med. May 2009
Built environment correlates of physical activity behaviours in a developing city: The case of Bogota, Colombia Olga Lucia Sarmiento and team Universidade de los Andes
Main Results Walking for transport (30 min/day for at least 5 days/week) was positively associated with: Street density (POR 1.71, 95% CI 1.19-2.46) Street connectivity (POR 2.21, 95% CI 1.40-3.49) Bus Rapid Transit stations in the neighborhood (POR 1.71, 95% CI 1.19-3.47) Leisure time physical activity (30 min/day for at least 5 days/week) was positively associated with: Park density (POR 2.05, 95%CI 1.13-3.72) Bus Rapid Transit stations in the neighbohood (POR 1.27, 95% CI 1.07-1.50)
People with access to parks & recreation Facilities are more likely to be active
A national study of US adolescents (N=20,745)* found a greater number of physical activity facilities is directly related to physical activity and inversely related to risk of overweight Odds of having 5 or more bouts of MVPA 1.26 Referent Odds of being overweight .68 *using Add Health data Gordon-Larsen et al, Pediatrics, 2006 http://www.pediatrics.org/cgi/content/full/117/2/417
People are Most Active on Tracks and Walking Paths Cohen. RAND
Walkability > Driving > Obesity? Lopez Zetina 2006
Obesity falls sharply with increased walking, cycling, and transit use! Credit: John Pucher
Neighborhood Walkability and Active Commuting to School • 201 parents of children aged 4 to 17 • Active commuting to school: • 25% in hi-walkable neighborhoods • 11% in lo-walkable neighborhoods • Parent concerns, mostly about traffic, were higher in lo-walkable neighborhoods • Kerr, et al. MSSE, 2006
Where do people bicycle?The role of infrastructure in determining bicycling behavior Jennifer Dill, Ph.D. Center for Transportation Studies
Where do people bicycle in Portland, OR? Based on GPS. Jennifer Dill. J Public Health Policy. 2008.
Odense – The National Cycle City of Denmark • The Ministry of Traffic designated Odense as Denmark’s National Cycle City 1999-2002 (186.000 citizens)
II - IV Right-hand turn lanes
II - IV Awareness of cyclists
Odense – The National Cycle City of Denmark • Results • 1999-2003: • > 50 sub-projects • Bicycle traffic increase by 20% • Accidents involving cyclists decrease by 20% www.cyclecity.dk
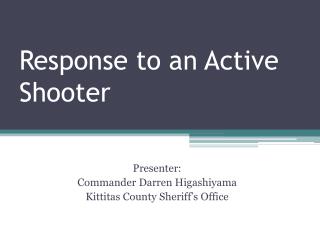
Increase in Bike Share of Trips in Cities Around the World Source: Pucher, Dill, and Handy, “Infrastructure, Programs, and Policies to Increase Bicycling,” Preventive Medicine, Jan 2010, Vol. 50, S.1, pp. S106-S125.
Bogota, Colombia has invested heavily in walking, cycling, & PA events
Brisbane, Australia has invested in pedestrian facilities *Beautiful pedestrian bridge *Walkways along the river *Pleasing aesthetics
Amsterdam is a model for being friendly to pedestrians & cyclists The Incredible Bicycle Parking Structure At the Train Station
Decisions about Climate change and Controlling chronic Disease are related