Download
1 / 40
400 likes | 791 Views
Nonparametric tests and ANOVAs: What you need to know. Nonparametric tests. Nonparametric tests are usually based on ranks There are nonparametric versions of most parametric tests. Parametric. Nonparametric. One-sample and Paired t-test. Sign test. Mann-Whitney U-test.

E N D
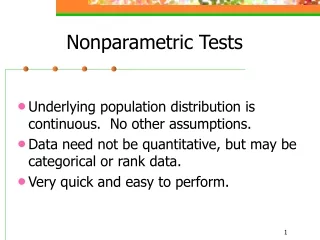
Nonparametric tests • Nonparametric tests are usually based on ranks • There are nonparametric versions of most parametric tests
Parametric Nonparametric One-sample and Paired t-test Sign test Mann-Whitney U-test Two-sample t-test
Quick Reference Summary: Sign Test • What is it for? A non-parametric test to compare the medians of a group to some constant • What does it assume? Random samples • Formula: Identical to a binomial test with po= 0.5. Uses the number of subjects with values greater than and less than a hypothesized median as the test statistic. P = 2 * Pr[xX] P(x) = probability of a total of x successes p = probability of success in each trial n = total number of trials
Sign test Null hypothesis Median = mo Sample Test statistic x = number of values greater than mo Null distribution Binomial n, 0.5 compare How unusual is this test statistic? P > 0.05 P < 0.05 Reject Ho Fail to reject Ho
Quick Reference Summary: Mann-Whitney U Test • What is it for? A non-parametric test to compare the central tendencies of two groups • What does it assume? Random samples • Test statistic: U • Distribution under Ho: U distribution, with sample sizes n1 and n2 • Formulae: n1= sample size of group 1 n2= sample size of group 2 R1= sum of ranks of group 1 Use the larger of U1 or U2 for a two-tailed test
Mann-Whitney U test Null hypothesis The two groups Have the same median Sample Test statistic U1 or U2 (use the largest) Null distribution U with n1, n2 compare How unusual is this test statistic? P > 0.05 P < 0.05 Reject Ho Fail to reject Ho
Mann-Whitney U test • Large-sample approximation: Use this when n1& n2 are both > 10 Compare to the standard normal distribution
Mann-Whitney U Test • If you have ties: • Rank them anyway, pretending they were slightly different • Find the average of the ranks for the identical values, and give them all that rank • Carry on as if all the whole-number ranks have been used up
Example Data 14 2 5 4 2 14 18 14
Example Sorted Data Data 14 2 5 4 2 14 18 14 22 4 5 14 14 14 18
Example Sorted Data Data 14 2 5 4 2 14 18 14 22 4 5 14 14 14 18 TIES
Example Sorted Data Data Rank them anyway, pretending they were slightly different 14 2 5 4 2 14 18 14 22 4 5 14 14 14 18 TIES
Example Sorted Data Data Rank A 14 2 5 4 2 14 18 14 22 4 5 14 14 14 18 12 3 4 5 6 7 8
Example Sorted Data Data Rank A Find the average of the ranks for the identical values, and give them all that rank 14 2 5 4 2 14 18 14 22 4 5 14 14 14 18 12 3 4 5 6 7 8
Example Sorted Data Data Rank A Average = 1.5 14 2 5 4 2 14 18 14 22 4 5 14 14 14 18 12 3 4 5 6 7 8 Average = 6
Example Sorted Data Data Rank A Rank 14 2 5 4 2 14 18 14 22 4 5 14 14 14 18 12 3 4 5 6 7 8 1.51.5 3 4 6 6 6 8
Example Sorted Data Data Rank A Rank 14 2 5 4 2 14 18 14 22 4 5 14 14 14 18 12 3 4 5 6 7 8 1.51.5 3 4 6 6 6 8 These can now be used for the Mann-Whitney U test
Benefits and Costs of Nonparametric Tests • Main benefit: • Make fewer assumptions about your data • E.g. only assume random sample • Main cost: • Reduce statistical power • Increased chance of Type II error
When Should I Use Nonparametric Tests? • When you have reason to suspect the assumptions of your test are violated • Non-normal distribution • No transformation makes the distribution normal • Different variances for two groups
Quick Reference Summary: ANOVA (analysis of variance) • What is it for? Testing the difference among k means simultaneously • What does it assume? The variable is normally distributed with equal standard deviations (and variances) in all k populations; each sample is a random sample • Test statistic: F • Distribution under Ho: F distribution with k-1 and N-k degrees of freedom
Quick Reference Summary: ANOVA (analysis of variance) • Formulae: = mean of group i = overall mean ni = size of sample i N = total sample size
ANOVA Null hypothesis All groups have the same mean k Samples Test statistic Null distribution F with k-1, N-k df compare How unusual is this test statistic? P > 0.05 P < 0.05 Reject Ho Fail to reject Ho
Quick Reference Summary: ANOVA (analysis of variance) • Formulae: There are a LOT of equations here, and this is the simplest possible ANOVA = mean of group i = overall mean ni = size of sample i N = total sample size
dfgroup = k-1 dferror = N-k
Sum of Squares Mean Squares F-ratio df dfgroup = k-1 dferror = N-k
Additions to ANOVA • R2 value: how much variance is explained? • Comparisons of groups: planned and unplanned • Fixed vs. random effects • Repeatability
Two-Factor ANOVA • Often we manipulate more than one thing at a time • Multiple categorical explanitory variables • Example: sex and nationality
Two-factor ANOVA • Don’t worry about the equations for this • Use an ANOVA table
Two-factor ANOVA • Testing three things: • Means don’t differ among treatment 1 • Means don’t differ among treatment 2 • There is no interaction between the two treatments