Download
1 / 24
240 likes | 460 Views
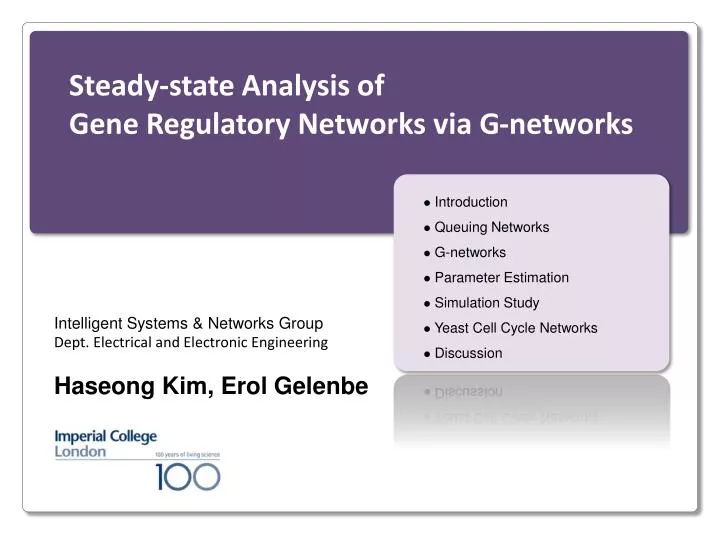
Steady-state Analysis of Gene Regulatory Networks via G-networks. Introduction Queuing Networks G-networks Parameter Estimation Simulation Study Yeast Cell Cycle Networks Discussion. Intelligent Systems & Networks Group Dept. Electrical and Electronic Engineering

E N D
Steady-state Analysis of Gene Regulatory Networks via G-networks • Introduction • Queuing Networks • G-networks • Parameter Estimation • Simulation Study • Yeast Cell Cycle Networks • Discussion Intelligent Systems & Networks Group • Dept. Electrical and Electronic Engineering Haseong Kim, ErolGelenbe
Introduction Introduction • Fundamental challenges of systems biology • Modeling regulatory interactions of genes by using mathematical & statistical methods • Exploring the dynamics of the gene regulatory networks (GRNs) by analyzing their long-run (steady-state) behaviors
Introduction Objective Gene Regulatory Network Structures • Infer the steady-state probabilities of genes in GRNs • G-network Theory Microarray Gene Expression
Queuing Networks A Simple Queuing System Server Queuing system Queue Customer l: Input rate m : Service rate q : Utilization rate (Steady-state probability that a server is busy)
Queuing Networks A Jackson Network (The Simplest Queuing Network) Let ki be the length of ith queue. P(K1=k1, K2=k2, K3=k3, K4=k4) =P(K1=k1)P(K2=k2)P(K3=k3)P(K4=k4) where P(Ki=ki)=qiki(1-qi) James R. Jackson, 1963
G-networks G-Networks • G-networks have positive, negative customers and signals E. Gelenbe, 1991, 1993
G-networks G-networks for GRNs A. Araziet. al., 2004 E. Gelenbe, 2007
G-networks E. Gelenbe, 2007
G-networks The Solution of the G-networks E. Gelenbe, 2007
G-networks Parameter Estimation P+(i,j) =P-(i,j) =Q(i,j,l) =Q(j,i,l) =1 ri = number of outdegrees of gene i mi = mRNA degradation rate of gene i
G-networks Parameter Estimation Boundary of total input rate Li Initial transcription rate without any external effects Positive Inputs from other genes are zero and queues fully work
G-networks Parameter Estimation Compute qiu by solving the following equation numerically Select Li* and qi* which are maximizing the Liu
4-gene Networks Stochastic Gene Expression Model H. McAdams and A. Arkin, 1997 J. Paulsson, 2005 A. Riberio et al., 2006
4-gene Networks 4-Gene Network Example Gillespie Algorithm (D. Gillespie, 1977) Generalized Gillespie Algorithm (D. Bratsun, 2005)
4-gene Networks Parameters of the Stochastic Gene Expression Model Table 1
4-gene Networks Data Generation • Two sets of data • Normal vs. Abnormal • The normal set is obtained by using the parameters in Table 1 • The abnormal set is the same as the normal set except the transcription rate of GA = 0.0012 sec-1 is a half of the normal transcription rate 0.0025 sec-1
4-gene Networks Normal Abnormal
4-gene Networks Simulation Results 20 datasets each of which have randomly selected 50 samples Compute steady-state probabilities and p-values of t-test
Yeast Cell Cycle Yeast Cell Cycle Wittenberg C. 2005 Bahler J. 2005 Bloom J. 2007
Yeast Cell Cycle Reconstructed Cell Cycle GRN
Yeast Cell Cycle Expression Data • D. Olando et. al., 2008 • Yeast 2.0 oligonucleotide array • To determine which transcription factors contribute to CDKs and to global regulation of the cell cycle transitions • Two types of groups • Wide-type (WT) (30 time points) • Cyclin-mutant (CM) (30 time points)
Yeast Cell Cycle 13 Genes Expression Profiles
Conclusions & Discussions • Analyze the steady-state of GRNs by using G-networks • In simulation study, our model provides more reliable measure then the t-statistics. • Our G-networks are applied to the yeast cell cycle data • The structure is too simple to draw the same conclusion with the original paper of the experiment data. • More complex and large-scale networks are required • Future works • Improve G-network model by providing proper probabilities P+(j,i), P-(j,i), Q(i,j,l)with ensemble base GRN estimation method (H. Kim et al, 2009) • Steady-state analysis for both transcriptional and post-transcriptional networks (E. Gelenbe., 2008)