Download
1 / 38
380 likes | 503 Views
A model for understanding disparities in health and health care. Scott Commins & Dr. Raymond Greenberg. Figure 1 - Survival of males to the age of 65 in Harlem, Bangladesh, and among U.S. Whites in 1980 ( NEJM , 1990; 174). Life expectancy at birth (years). White Male. Black Male. White

E N D
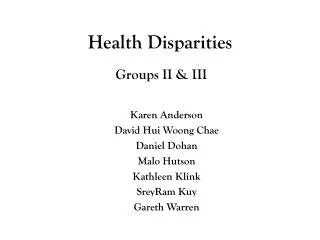
A model for understanding disparities in health and health care Scott Commins & Dr. Raymond Greenberg
Figure 1 - Survival of males to the age of 65 in Harlem, Bangladesh, and among U.S. Whites in 1980 (NEJM, 1990; 174).
Life expectancy at birth (years) White Male Black Male White Female Black Female Figure 2 - Life expectancy (in years) at birth by race and sex, United States, 1998.(Source: Health, United States, 2000)
RACE Life Expectancy Cause of Death
Deaths per 100,000 persons White Male Black Male White Female Black Female Figure 3 - Age-adjusted death rates from all causes by race and sex, United States, 1998.(Source: National Vital Statistics Reports 2000; 48 (11): 63)
Deaths per 100,000 persons 50 White Male Black Male White Female Black Female Figure 4 - Age-adjusted death rates from heart disease by race and sex, United States, 1998.(Source: Natl. Vital Stat. Rep. 2000; 48 (11): 63)
Deaths per 100,000 persons 0 White Male Black Male White Female Black Female Figure 5 - Age-adjusted death rates from cancer by race and sex, United States, 1998.(Source: Natl. Vital Stat. Rep. 2000; 48 (11): 63)
Deaths per 100,000 persons 0 White Male Black Male White Female Black Female Figure 6 - Age-adjusted death rates from stroke by race and sex, United States, 1998.(Source: Natl. Vital Stat. Rep. 2000; 48 (11): 64)
Deaths per 100,000 persons 0 White Male Black Male White Female Black Female Figure 7 - Age-adjusted death rates from diabetes mellitus by race and sex, United States, 1998.(Source: Natl. Vital Stat. Rep. 2000; 48 (11): 63)
Deaths per 100,000 persons 0 White Male Black Male White Female Black Female Figure 8 - Age-adjusted death rates from hypertension by race and sex, United States, 1998.(Source: Natl. Vital Stat. Rep. 2000; 48 (11): 63)
II. What is it about race? • Understanding the basics: • Do racial differences exist • in socioeconomic indicators?
0 White Black Figure 9 - People living in poverty by race, United States, 1999.(Source: US Census Bureau)
0 < H S Grad H S Grad Some College College Grad + Figure 10 - Educational attainment of adults 25 years or older by race, United States, 2000.(Source: US Census Bureau)
0 I II III IV V Figure 11 - Quintiles of household income by race, United States, 1999.(Source: US Census Bureau)
III. Do the differences in SES indicators affect health? • Proposing a model: • How do we examine the cause(s) of disparities in health?
Poverty/Lower SES Substandard Living Conditions Risk- Promoting Lifestyle Diminished Access to Health Care Poor Nutrition Unemployment
Figure 12 - Percentage of persons under age 65 years with private medical insurance by income, United States, 1997.(Source: Health, United States, 2000) Private Medical Insurance (%) 0 200+ <100 100-149 150-199 % of Poverty Level
Private Medical Insurance (%) 0 White Black Figure 13 - Percentage of persons under age 65 years with private medical insurance by race, United States, 1997.(Source: Health, United States, 2000)
Persons with two or more ER visits/year (%) 0 Poor Near Poor Non- Poor Figure 14 - Percentage of persons 18 years or older with 2 or more emergency room visits in the past year, United States, 1998.(Source: Health, United States, 2000)
Children with no usual source of health care (%) 0 Poor Near Poor Non- Poor Figure 15 - Percentage of children less than 18 years old with no usual source of health care, United States, 1997-98.(Source: Health, United States, 2000)
Poverty/Lower SES Substandard Living Conditions Risk- Promoting Lifestyle Diminished Access to Health Care Poor Nutrition Unemployment
Children with high blood lead levels (%) 0 Low Middle High Figure 16 - Percentage of children 1-5 years old with blood lead levels 10 ug/dlby family income, United States, 1991-94.(Source: NHANES III, 1996)
Figure 17 - Percentage of persons with blood lead levels 10 ug/dlby family income, United States, 1991-94.(Source: NHANES III, 1996) Persons with high blood lead levels (%) 0 Low Middle High
Poverty/Lower SES Substandard Living Conditions Risk- Promoting Lifestyle Diminished Access to Health Care Poor Nutrition Unemployment
Children with food insufficiency (%) 0 Low Middle High Figure 18 - Percentage of children age 16 years or less with food insufficiency by family income, United States, 1988-94.(Source: NHANES III, 1996)
Children with iron deficiency (%) 0 Low Middle High Figure 19 - Percentage of children 6-16 years old with iron deficiency by family income, United States, 1988-94.(Source: NHANES III, 1996)
Poverty/Lower SES Substandard Living Conditions Risk- Promoting Lifestyle Diminished Access to Health Care Poor Nutrition Unemployment
Percent unemployed White Male Black Male White Female Black Female Figure 20 - Unemployment rate of civilian labor force age 20 years or older by race and sex, United States, July, 2001.(Source: Bureau of Labor Stats., July, 2001)
Poverty/Lower SES Substandard Living Conditions Risk- Promoting Lifestyle Diminished Access to Health Care Poor Nutrition Unemployment
Prevalence of cigarette smoking (%) 0 H S Grad Some College < H S Grad College Grad + Figure 21 - Prevalence of cigarette smoking among white males 25 years or older by educational attainment, United States, 1998.(Source: Health, United States, 2000)
Prevalence of cigarette smoking (%) Unemployed Employed Figure 22 - Prevalence of cigarette smoking among adults by employment status, South Carolina, 1995-96.(Source: SC Prevention Adult Household Telephone Survey, 1995-96)
Prevalence of cigarette smoking (%) 15 White Male Black Male White Female Black Female Figure 23 - Prevalence of cigarette smoking among persons 25 years or older by race and sex, United States, 1998.(Source: Health, United States, 2000)
Prevalence of obesity (%) 10 White Male Black Male White Female Black Female Figure 24 - Prevalence of obesity by race and sex, United States, 1988-94.(Source: Health, United States, 2000)
Poverty/Lower SES Substandard Living Conditions Risk- Promoting Lifestyle Diminished Access to Health Care Poor Nutrition Unemployment
IV. Employing the Model An Illustrative Example: Childhood Lead Toxicity
Good Health Care? You memorized the high lead threshold and used proper medical intervention, but have you addressed the underlying issues? Probably not, because doing so requires identification of the contributing factors and intervening on numerous levels...
Contributing Factors • Unhealthy environment - Increased risk of exposure to lead-based paint • Parental education - Lack of knowledge regarding hazards • Access to care - Poor screening results in delayed detection and treatment
Public Health Perspective • Treating the lead poisoning alone may not be • sufficient for this child • Treating this child alone may not be sufficient • for the community