Download
1 / 24
240 likes | 334 Views
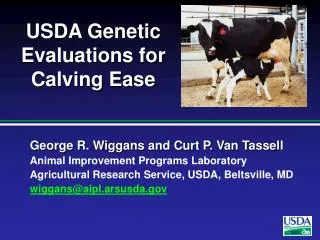
USDA Genetic Evaluations for Type Traits. Type Traits. Describe physical characteristics of animal Final Score (overall assessment) Scored 50-99 Linear traits (13 traits) Scored 1-50. History of Type Evaluations. 1986 – Sire model for final score 1988 – Collection of linear traits

E N D
Type Traits • Describe physical characteristics of animal • Final Score (overall assessment) • Scored 50-99 • Linear traits (13 traits) • Scored 1-50
History of Type Evaluations • 1986 – Sire model for final score • 1988 – Collection of linear traits • 1989 – Sire model for linear traits • 1995 – Multi-trait animal model • 2000 – Base change • 2005 – Base change
Evaluation model • An equation that indicates what factors contribute to an observation • Separates the genetic component from other factors • Solutions used to predict the genetic potential of progeny
Type Evaluation Model MODEL: y = h + a + p + e y = Adjusted type record h = Herd appraisal date a = Animal genetic effect (breeding value) p = Permanent environment Non-genetic effect common to all a doe's appraisals e = Unexplained residual
Multi-trait Model • Scores from one trait affect the evaluation of other traits through the genetic correlations
Genetic Parameters • Heritability – Portion of variation due to genetics • Repeatability – Similarity of repeated records, includes genetic and permanent environmental effects
Methods of Expressing evaluations • Estimated breeding value (EBV) • Animal’s own genetic value • Predicted transmitting ability (PTA) • ½ EBV • Expected contribution to progeny
Combining type and production Production-Type index (PTI) • Combines yield and type evaluations into a single value • There are 2 versions: • PTI 2:1, weights 2 production : 1 type • PTI 1:2, weights 2 type : 1 production
AIPL web services http://aipl.arsusda.gov/query/public/tdb.shtml#GoatsTBL • Queries provide display of: • Pedigree information • Yield records • Herd test characteristics • Genetic evaluations of does & bucks • Yield • Type • Access information using: • ID number • Animal name • Herd code
Summary • Type data contributes to genetic evaluations of Final Score and 13 linear traits • Multi-trait Animal Model combines information from all relatives and traits • Few bucks have many daughters in many herds so reliability is low • Production-type index combines evaluations • Substantial genetic progress is occurring in several traits