Download

1 / 31
310 likes | 456 Views
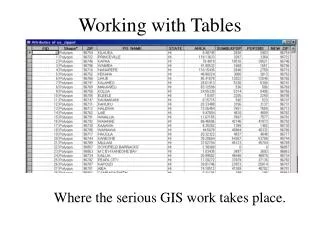
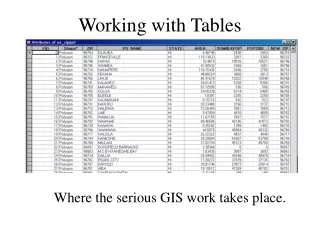
Working with Tables. Viewing Attribute Data. attribute data are organised in database tables ArcMap Right click a data layer in the data frame Open Attribute Table OR create a report or graph ArcCatalog Click on a layer and preview the table. Table Window.

E N D
Viewing Attribute Data • attribute data are organised in database tables • ArcMap • Right click a data layer in the data frame • Open Attribute Table • OR create a report or graph • ArcCatalog • Click on a layer and preview the table
Table Window • Rows (Records) + Columns (Fields) • Features or standalone table • Dynamic contents – move fields, change fonts, freeze Rows (Records) Columns (Fields) Unique ID
Tabular Data Field Types • Different field types store different kinds of values • Choose the right field type for the right value • Field types vary according to table format • Text, date, short, long, BLOB (graphics), double • CNTRY_NAME: Russia – text • POP_CNTRY: 151,827,600 – long • COLOR_MAP: 3 – short • SHAPE_AREA: 321294461992.126 – double • Layer Properties Field tab
Navigating Tables • Show All or Show Selected features • Highlight records within show selected view Show selected and show all views Navigate rows
Table Window Menus • Menus for row, columns and cells – right-click
Options Menu Options menu is drop down
ArcToolbox • Access this through the ArcToolbox icon: • Contains a variety of geoprocessing tools • Functions in ArcToolbox can sometimes be carried out in context menus (right-clicking) • Extensions will also appear • Will be looking at some of the Analysis Tools tomorrow
Creating A New Field • Suppose you want to calculate a value in a table based on existing data • Need to add a new field • Can add a field through the Data Management Tool • Can add a new field through the Options menu in the table
Calculations in a New Field • Can do this either through ArcToolbox or the Column Context Menu (right-click on column name) • Both present you with a Field Calculator • Can also delete the field if you are not happy with it = permanent!
Editing Data in the Table • Enable the Editing Toolbar (View Toolbars Editor) • Open the attribute table you want to edit • Start Editing – headings of the table will go white • Make changes • Stop Editing and choose whether you want to save
Working with Tables • Hands-on Exercise #5
Basic Statistics on a Field • You can generate basic statistics on any field in the table • Click on the name and right-click to select Statistics • Does NOT work on text fields
Statistics Summary • Can move between fields using the drop down box • Will only see fields that are numerical
Summarise by a Field • Might want to sum up occurrences of an event in an area • Might want to find out the min or max value of an event in an area • E.g. summarise the number of pupils by LEA
Calculations with Tables • Hands-on Exercise #6
Mapping Spatial Data from External Sources • Added by user with editing tools (tomorrow) • Postcode data • convert to Easting, Northing • Data from a GPS receiver • Depends on the GPS, e.g. the GPS might come with a facility to export a route to a shapefile • Excellent source of information: http://www.ordnancesurvey.co.uk/oswebsite/gps/
Bringing Data into ArcMap • Can load Excel files directly into ArcGIS • Use the Add Data button and select the sheet where the data are located (sheets are given a $) • Excel files are read only and can only be viewed • Need to conform to basic conventions: • One header line • No spaces in header names • Do not start headers with a number • Don’t format cells as % • KISS principle One Line Header No extra data over here
How to Map the Data - Points • Geocode your data – turn your postcodes into X,Y coordinates • Put these values into Excel – two columns with a single header • For version 9.1, create a .csv, .txt or .dbf file • Create X,Y data for points • Tools Add X,Y Data
Mapping Attribute Data from Another Table • Target table (map) + Source table (which you want to map) • Joins • 1 to 1 • Many to 1 • Relates • Above plus: 1 to Many + Many to Many • Relationship Classes
Attribute Join • Physical connection between two tables • Appends the attributes of the two tables • Assumes a 1-to-1 or many[target]-to-1 relationship
Attribute Join Options • Keep all rows – defaults • Keep only matching rows
Connecting Tables with Relates • Defines relationship between two tables • Tables remain independent • Can also have 1-to-many and many-to-many relationships • Make selection and then open related table • Discovers any related rows
Relate vs Relationship Class • Relate • Across different database tables • Created on the fly in ArcMap, saved in .MXD and .LYR files • Relationship Class (managed by the geodatabase) • Permanent relate • Within the same geodatabase • Only exists in a geodatabase
Steps on How to Map the Data • Join the data to a map file so that you can plot it • Create the file in Excel (and export to .dbf, .csv or .txt if 9.1) • Follow these basic rules: • Have a single line header, one name per column • Avoid spaces or strange characters in the header line • Avoid formatting as percentages • Avoid having any extra data outside of the rows and columns of your data • Avoid starting headings with a number
Steps on How to Map the Data • In ArcMap, open the file to which you want to add the data • You can open the .dbf/.csv/.txt file in ArcMap or browse • Right-click on the layer Joins and Relates • Choose the column for joining on from the map file that matches the one in the .dbf/.csv/.txt file • Select or browse for the .dbf/.csv/.txt file • Select the column in the .dbf/.csv/.txt file that is in common with the map file and then join • Save the map if you want the join to become permanent (right-click Data Export Data)
Troubleshooting • <Null> values – can occur if there are features in the map that did not occur in your .dbf/.csv/.txt file – become 0 when join is made permanent • <Null> values across the board – join was not successful • Check that you have chosen the correct columns on which to do the join • Make sure there are no spaces in the name/ids in one column but not the other (hidden spaces)
Bringing Data into ArcMap • Hands-on Exercise #7