Download
1 / 29
290 likes | 384 Views
Advanced indicators. Bruno Lapillonne, Vice President, Enerdata. Reunión Técnica de Trabajo del Proyecto BIEE 24 – 26 de febrero , 2014, San José, Costa Rica. Energy efficiency index Energy savings Decomposition of power sector consumption.

E N D
Advanced indicators Bruno Lapillonne, Vice President, Enerdata Reunión Técnica de Trabajo del Proyecto BIEE 24 – 26 de febrero, 2014, San José, Costa Rica
Energy efficiency index Energy savings Decomposition of power sector consumption
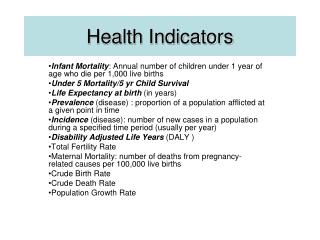
How energy efficiency progress is measured in ODYSSEE? • Progress in energy efficiency for final consumers is measured in ODYSSEE through an indicator, called ODEX, that is as much as possible cleaned from structural changes or other factors that have nothing to do with energy efficiency (e.g. increase in comfort or in equipment ownership, structural changes in industry, climate variations from one year to the other) • For each end-use sector (industry, transport, households, services), energy efficiency progress is measured at a detailed level by sub-sector (or end-use, or mode of transport), through reduction in specific energy consumption measured in physical units, to get an energy efficiency index by sector. • Energy efficiency progress is then evaluated at the level of the whole economy by weighting energy efficiency progress of each end-use sector, on the basis of their share in the final energy consumption. ODEX (“ODYSSEE energy efficiency index”)
How ODEX is calculated for each sector? • ODEX by sector is calculated from unit consumption trends by sub –sector (or end-use or mode of transport ) • By aggregation of unit consumption indices by sub-sector in one index for the sector on the basis of the current weight of each sub-sector in the sector’s energy consumption; • Unit consumption by sub-sector are expressed in different physical units so as to be as close as possible to energy efficiency evaluation : toe/ m2, toe/employee, kWh/appliance, toe/ton, litre/100km,… • ODEX is calculated on the basis of up to 35 sub- sectors (up to 7 modes in transport, 9 end-uses for households, 14 branches in industry and 5 sub-sectors in services.
ODEX indicators: case of EU averaage Energy efficiency index (ODEX) for final consumers (EU-27) • ODEX= 88 in 2010 12% energy efficiency improvement between 2000 and 2010 . • Regular and larger gains for households (1.6%/year). • No progress for industry since the beginning of the economic crisis (1.2%/year until 2007) • Lower progress for transport (0.9%/year), due to negative savings for the transport of goods since the economic crisis. ESD ODEX calculated as a 3 years moving average to avoid short term fluctuations (imperfect climatic corrections, behavioural factors, business cycles). Services not included due to the difficulty of measuring energy savings .
Rate of annual energy efficiency progress based on ODEX Energy efficiency improvement for final consumers in EU countries • Energy efficiencyimprovement from ODEX can also be expressed in %/year to assess the average annual rate of energy efficiency improvements; • 12% energy efficiency improvement between 2000 and 2010 at EU level means an average rate of improvement of 1.2%/year;
Energy efficiency index for industry • Evaluation carried out at the level of up to 14 branches, of which3 energy intensive branches: steel, cement and pulp & paper. • For each branch energy efficiency improvement is measured from the decrease of the specific energy consumptionexpressed in terms of energy used • per ton produced for energy intensive products(steel, cement, glass and paper) • per unit of production index for the other branches
Trends in ODEX in industry (EU-27) Around 25% progress in energy efficiency in industry in the EU-27 since 1990; slow progression since 1998 (1,4 %/year compared to 2.2%/year from 1990 to 1998) Not all branches are shown for sake of clarity
Energy efficiency index: principle of calculation: 1 Calculation of indices by branch and weighting
Energy efficiency index: principle of calculation: 2 Calculation of sector index (year t-1 as reference) IE91 = IE1990 x (98 x 0.48 + 97 x 0.52) = 97,4 IE92 = IE1991 x (96/98 x 0.44 + 87/97 x 0.56) = 90.9 IE93 = IE1990 x (96/96 x 0.46 + 83/87 x 0.54) = 88,6 gains of 11.4% in 1993 compared to 1990
Energy efficiency index for households • Calculated on 8 end-uses/appliances : heating, water heating, cooking, 5 large appliances (refrigerators, freezers, washing machine , dishwashers and TV) • Indicators used: • Heating: unit consumption per m2 at normal climate (toe/m2) (per dwelling equivalent with central heating) Water heating: unit consumption per dwelling with water heating Cooking: unit consumption per dwelling Large elec. appliances: specific consumption per appliance (kWh/year)
Energy efficiencyprogress for households in the EU-27 • Energy efficiency improved by 20% over the period 2000-2012, ie by 1.9%/year; • Since 1990 the improvement reaches 31% (or about 1.6%/year). • The efficiency improvement for heating reaches 20% since 2000 and 14% for large electrical appliances ODEX is an index weighting the energy efficiency progress for 8 end-uses/appliances.
ODEX Energy savings Decomposition of of power sector consumption
How to measureenergysavings • Two methods that are equivalent can be used to calculate energy savings by sector (in ktoe or GWh): • Sum the energy savings for each sub-sector (or end-use); • Direct calculation at sector level with ODEX indicator
Calculation of energy savings by end-use or sub-sector : example of refrigerators • The savings are given by the reduction in the specific consumption, in kWh/year for refrigerators or liters/100 km for cars. • A reduction of the average specific consumption of the refrigerator 'stock from 400 to 300 kWh per year in a country with 2 million of refrigerators will result in total electricity savings equal to 100 GWh in 2007 compared to 1990.
Calculation of energy savings by sub-sector: case of cement industry • Definition : at the level of an industrial branch i, energy savings are calculated from the variation of the consumption Ei due to a reduction in the specific energy consumption Ei/Qi between year t and a base year, as : Qt*(Eit/Qit-Eio/Qio) (Qi= output) • Example: case of energy savings in cement production between 1990 and 2010 • 1990 : Consumption : 0.85 Mtoe; production 10 Mt and specific energy consumption 0,085 toe/tonne • 2010: Consumption : 1.2 Mtoe; production 15 Mt and 0,08 toe/tonne Energy savings 15* (0,085- 0,08)=- 0.075 Mtoe
Calculation of energy sector directly at sector level with ODEX • Energy Savings (ES) can be directly derived from ODEX • ODEX is equal to the ratio between the energy consumption at year t (E) and a fictive consumption that would have happened without energy savings (ES): ODEX=E/(E+ES)*100 ES = E x ((100/ODEX)-1) • If energy consumption = 50 Mtoe and ODEX =80 Energy savings =50* ((100/80)-1)=12.5 Mtoe
Energy savings fro households (EU-27) Energy savings for households exceeded 70 Mtoe since 2000 : without energy efficiency improvement, the energy consumption would have been 70 Mtoe higher in 2012, ie the equivalent of the total consumption for water heating, electrical appliances and lighting; Mtoe
Indicators of energy savings Evaluation of energy savings for final consumers (EU-27) • About 120 Mtoe energy savings in 2010 compared to 2000 (i.e. 12% of final energy consumption). In other words without energy savings the final energy consumption would have been 12% higher in 2010. • Around 40% of total savings in households, 31% for industry, 29% for transport
ODEX Energy savings Decomposition of power sector consumption
Principles of the decomposition of the power sector Three main effects explain the variation of the net consumption for power generation over a period*: • The increased consumption of electricity, that all things being equal, contribute to increase the losses in power generation; • Changes in the power mix between different sources with very different efficiencies • wind, hydro, PVs (100% efficiency); • Thermal (between 30 and 50% depending on fuel mix and technology); • geothermal and nuclear (respectively 10% and 33%); • Variation in the efficiency of thermal power generation *net consumption for power generation= sum of input and outputsfor electricity generation
Decomposition of consumption for power generation: effects of increased electricity consumption The increase in the electricity consumption (+1,6 Mtoe) translates into a much larger consumption in the power sector (+ 4 Mtoe); + 4 Mtoe + 1,6 Mtoe Efficiency and power mix assumed constant and equal to 40%
Principles of the decomposition of the power sector (cont’d) • Apart from the effect of the increased consumption of electricity, the actual consumption of the power sector is in addition depending on changes in the power mix % (power mix effect) and changes in the efficiency of thermal power generation (efficiency effect). • These two effects are calculated as the difference between the actual consumption of the power sector in 2010 and a fictive consumption : • at 1990 power mix and 2010 power efficiency for the power mix effect • At 1990 efficiency and 2010 power mix for the efficiency effect
Decomposition of consumption for power generation: effect of changes in power mix and thermal efficiency The increase in the electricity consumption increased consumption in the power sector by 4 Mtoe all things being equal; the actual variation in the power sector consumption is lower (3 Mtoe) due to savings from changes in power mix (0,7 Mtoe) and efficiency gains in thermal power generation (0,3 Mtoe) -0.7 Mtoe + 4 Mtoe -0.3 Mtoe + 3 Mtoe
The increasing share of thermal power generation between 2005 and 2011 in Costa Rica from 3 to 9% contributed to increase the power sector consumption, and thus the primary energy consumption by around 800 ktoe, all things being equal. • The increase of the thermal power generation efficiency from 31 to 37% resulted in marginal savings (40ktoe) due to te low share of thermal power. • Decomposition of the power sector consumption variation • Case of Costa Rica (2005-2011)
In Spain, the primary consumption increased much less than the final consumption (- 4,4 Mtoe), due to significant savings in the power sector (9,3 Mtoe), of which 5,2 Mtoe due to increased efficiency of thermal power generation (penetration of CCGT) and 4.1 Mtoe due to a rapid penetration of wind and solar; these savings were partially offset by the increased consumption of electricity that contributed to raise the consumption of the power sector by 2,7 Mtoe • Decomposition of the primaryenergyconsumption variation (2000-2010): • Case of Spain Power sectorconsumption variation (-6.6 Mtoe) -4,4 Mtoe 2,2 Mtoe
Decomposition of the final energy consumption variation • A decomposition can be carried out for each main end-use sector (industry, transport, household and services ... As shown for electrical appliances in the household sector . • For each sector, the decomposition is calculated as the sum of the decomposition for each end-use or sub-sector, since, as we are dealing with volumes in ktoe the factors can be added
Decomposition of the final energy consumption variation • Consumption increased by 16 Mtoe between 2000 and 2010 • Economic activity contributed to an increase of 122 Mtoe (of which 48 Mtoe due to traffic increase in transport, 42 Mtoe to more dwellings), the effect of which was more than offset by energy savings (128 Mtoe). • Other drivers were: structural changes (+2 Mtoe), lifestyles (18 Mtoe), climate variation ( 32 Mtoe) and other factors (mainly behavioural changes; 26 Mtoe). Drivers of the variation of the final energy consumption in the EU between 2000 and 2010
Decomposition of the final energy consumption variation • Primary energy consumption increased by 34 Mtoe between 2000 and 2010 • More activity (including lifestyle and penetration of electricity) contributed to an increase of 172 Mtoe; • Part of the effect was offset by energy savings (162 Mtoe). • Other drivers were: climate variation (32 Mtoe) and other factors (mainly behavioural changes 26 Mtoe). Drivers of the variation of the primary energy consumption in the EU between 2000 and 2010