Download
1 / 26
260 likes | 413 Views
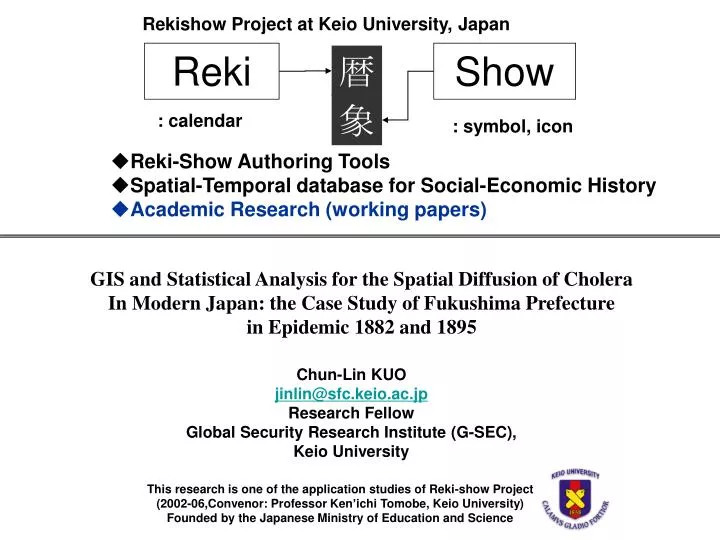
Rekishow Project at Keio University, Japan. Reki. Show. 暦. 象. : calendar. : symbol, icon. Reki-Show Authoring Tools Spatial-Temporal database for Social-Economic History Academic Research (working papers). GIS and Statistical Analysis for the Spatial Diffusion of Cholera

E N D
Rekishow Project at Keio University, Japan Reki Show 暦 象 : calendar : symbol, icon • Reki-Show Authoring Tools • Spatial-Temporal database for Social-Economic History • Academic Research (working papers) GIS and Statistical Analysis for the Spatial Diffusion of Cholera In Modern Japan: the Case Study of Fukushima Prefecture in Epidemic 1882 and 1895 Chun-Lin KUO jinlin@sfc.keio.ac.jp Research Fellow Global Security Research Institute (G-SEC), Keio University This research is one of the application studies of Reki-show Project (2002-06,Convenor: Professor Ken’ichi Tomobe, Keio University) Founded by the Japanese Ministry of Education and Science
Investigate the outbreak of an epidemic is an opportunity to realize the conversion of society, and the spatial diffusion of an epidemic is also an index toward better understanding the historical change of the regional reconstruction. 1.Introduction and Review Issues of studying Historical Diseases Medical Science and Public Health Historical GIS Historical and Disease Geography Disease and Environmental History • GIS is a useful platform for the study of historical diseases. GIS can overlook a location in different phase and integrate with historical, archeological and disease events to translate textual description and numerical evidence digitally into spatial probability and conceptualized historical fuzzy pictures.
Cholera Epidemic in the 19th century Diffusion without Japan ? Source: World atlas of epidemic Diseases (2004)
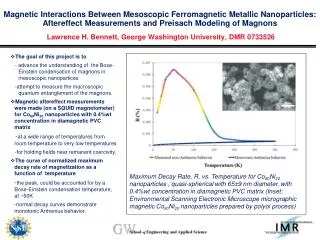
Cholera was an ‘initiator’ of sanitary reform in Japan. The outbreak of cholera facilitated the maintenance of sewer system and related public health environment in modern Japan. A large body of literature has been generated on the role and influences of cholera epidemics on the development of public-health policies, sanitation procedure, and urban reformation. Study of cholera in Japan still in need to have a geographical review and a systematic spatial analysis. After the Japan’s Meiji restoration(1868), major outbreak took placeevery 3-5 years until 1895.The records provide valuablematerial to investigate the regionalreform and the process of theCivilization in modern Japan. Human Human Water, Food Simple Transmission Model forInfections of Human by Cholera Cholera and the Modernization of Japan
2.Framework and Objective Framework • Data and the usage of GIS • Sanitary reports in modern Japan • Database formation by GIS • Cholera Epidemic in Modern Japan • Epidemic Waves • Geographic Characteristics • Diffusion Pattern • Diffusion routes and local network • Temporal and Geographic trends of an Epidemic • Diffusion Process • Modeling the diffusion of Epidemic 1895 • Temporal investigation of diffusion process Objectives To explore methods evaluating the changes of regional reconstruction after the Japan’s Meiji restoration by examining the most critical cholera epidemic waves in the late 19th in Japan. To link the “Cholera Ryuko Kiji”, the most detail cholera epidemic report in Japan, with spatial diffusion models to better depict the movement of this infectious disease over time and space.
The report of the central sanitary bureau (since 1876): The most important material in understanding the sanitary situation and disease distribution of the whole country in modern Japan. (Digital Archive) Cholera RyuKo Kiji (Epidemic Report) published by local government (since 1882):The information in the Cholera Epidemic Report can be divided into three categories: textural accounts; numerical evidence; and disease maps. (Digital Library) 3.Data and the usage of GIS Texturalaccounts Numerical evidence Disease maps • Disease attribute • Cholera cases • Patient’s info • Infected villages • First infected date • Reason of infection • Other attribute data • Spatial attribute • Map images • Place name • Boundaries • Diffusion routes • Other spatial info Geo-database Spatial calculation Overlay modeling Diffusion pattern Diffusion system Diffusion process
Data source: Cholera Ryuko-Kiji (Epidemic Report) in Modern Japan
The progresses of transforming the Cholera Epidemic Report National Diet Library
Applying GIS in Attribute Data Integration and Database Formation Geo- database
Fukushima Prefecture Cholera Diffusion in National Scale (Temporal perspective) Epidemic 1879 Epidemic 1882 Epidemic 1886 Epidemic 1890
The front door of Tohoku (North-East) Region linking Japan’s capital Tokyo and Tohoku region. Share borders with six prefectures, without any international harbors. Dived from east to west into three regions of Hana-dori (coastal region), Naka-dori (inland region), and Aizu by natural environment. 1868 Meiji Reconstruction 1871New Prefectural system 1876Fukushima prefecture 1882Cholera outbreak 1886Boundary consolidation 1887Tohoku Honsen Railway 1895Sino-Japanese WarCholera outbreak Study Area: Fukushima Prefecture Chronology Naka-dori region Aizu region Hama-dori region
There was a time delay of cholera diffusion between the first case in Japan and the first record in Fukushima for more than 6 months. The peak of outbreak in Fukushima was one month later than the peak of the whole country. Comparing the two Epidemic waves, the time they reached the peak were close, but there were opposite mirror trend of the two waves. Epidemic Waves Epidemic 1882 Epidemic 1895
The diffusion pattern in epidemic 1882 was limited by geographical condition and local accessibility in Auzi, Naka-dori, and Hama-dori region of Fukushima prefecture The diffusion pattern in Epidemic 1895 reflected that most of the cholera cases clustered in transportation hub of Kaido (main road) network and addressed the active interactions between Naka-dori and Hama-dori region. Results of analyzing the diffusion patterns • The patterns of cholera distribution strongly support the hypothesis that different diffusion systems occupied the diffusion in separated region of Fukushima. • The difference of these diffusion patterns could be explained by its specific geographic context and socio-economic network. Changing Mechanism & Diffusion Process??
Spatial Diffusion Relocation diffusion Expansion diffusion Contagious Diffusion Hierarchical Diffusion Mixed Diffusion Model of diffusion process The time-ordered sequence of appearance of a disease pattern has a dynamic relationship with an urban system, in which the size of an urban population and the geographic distance from the initial introduction are functioned as Hi is the household of a infected village/town i in 1895, Di is the direct distance from Origin to a infected village ui is Random disturbance, and is constant term. Multi-regression model 6.Diffusion Process
Diffusion System in Fukushima: Epidemic 1895 Mixed diffusion Miyagi system Tochigi system Ibaraki system Relocation diffusion Contagious diffusion
Temporal Investigation of Diffusion Process Miyagi System Mixed diffusion Ibaraki System Contagious diffusion Tochigi System Relocation diffusion Epidemic Waveof Fukushima
Findings of analyzing the diffusion process • Although the outbreak of cholera various in different diffusion systems, the date when the epidemic arrive the major city occurred closely. In other words, no matter what kinds of process it was, the major cities of each system fallen at the same time. • The epidemic wave of mixed and contagious diffusion reached the peak at the same period closing the fallen date of major city. While, relocation diffusion may have several increasing waves and the dates of peak was irregularity. • Types of accumulating curve differed in each diffusion process that mixed process presented a short and rapidly curve, contagious process presented diverse phases of increasing, and relocation process showed a continued growth curve.
Findings of analyzing the diffusion process • Although the outbreak of cholera various in different diffusion systems, the date when the epidemic arrive the major city occurred closely. In other words, no matter what kinds of process it was, the major cities of each system fallen at the same time. • The epidemic wave of mixed and contagious diffusion reached the peak at the same period closing the fallen date of major city. While, relocation diffusion may have several increasing waves and the dates of peak was irregularity. • Types of accumulating curve differed in each diffusion process that mixed process presented a short and rapidly curve, contagious process presented diverse phases of increasing, and relocation process showed a continued growth curve.
Miyagi system presents a typical hierarchical process that major city fallen less than a week and reached the peak of epidemic wave rapidly. While the epidemic also spread contagiously between villages at the same time that emerged a mixed diffusion process. This diffusion process also suggested that the urban system had been formed surrounding the Fukushima city in the late 19th century. Findings of Miyagi system (Mixed diffusion)
Findings of Ibaraki system (contagious diffusion) • The accumulation curve of Ibaraki system presents three stages of diffusion, where the stage one turned to stage two at mid-August and then turned to stage three at mid-September. It is notably that urban hierarchy did not exist in this region and contagious diffusion was the main process for this period leading to the epidemic peak.
Findings of Tochigi system (relocation diffusion) • There was no significant proof to support a hierarchical or a contagious process in the south of Naka-dori and part of Auzi region. Study of Tochigi system also indicated that a relatively complex geographic condition existed in this region and the network of settlement turned to be scattered in the late 19th century.
7.Conclusion • This paper was designed to investigate the spatial diffusion of epidemic cholera in terms of exploring methods toward better understanding the dynamics of regional reconstruction in modern Japan. • The analysis has been facilitated by the richness of the information contained in Cholera Epidemic Report of Fukushima and several Digital Archive programs. • GIS and statistical methods play an important role in this experimental study of Fukushima Prefecture. • The comprehension of this case studysuggests further research with systemic investigations among neighbor prefectures and the whole country. For more information, please visit our web site: http://www.fcronos.gsec.keio.ac.jp Thank You