Download

1 / 65
650 likes | 722 Views
Dive into the intricate web of food distribution in Illinois, analyzing consumer demand, producer supply, and market dynamics. Explore the invisible hand of market forces and the complexity of meeting diverse tastes while avoiding shortages and waste.

E N D
Markets are Perfect,Except When They’re Not the invisible hand of market allocation
Feeding Illinois for a Week There are about 13 million people in Illinois and we spend between $350 to $700 Million on eating each week. Almost half of that spending is in restaurants and Illinois restaurants employ more than 500,000 people. Illinois grocery stores employ over 100,000 people, and there are 270 farmer’s markets. About 96% of what we eat comes from out-of-state, our fruits & vegetables travel an average of 1,500 miles. Chicago has less than a week’s worth of food on hand. Consider the range of resources involved and the simple transport & logistics of this weekly challenge. Add the complexity of satisfying diverse individual tastes and solving every piece of this puzzle in a timely fashion. Try to get this done without evident shortages or waste.
Free Markets at Work Adam Smith (1776) claimed the following: “It is not from the benevolence of the butcher, the brewer, or the baker, that we expect our dinner, but from their regard to their own interest.” We respond to incentives (MB & MC) and are led by an invisible hand (market prices) to promote an end (society’s well-being) despite that not being our intention. Alfred Marshall (1890) provided a useful framework: The first step in economic reasoning is to examine demand and supply, and their connection to price adjustments.
Consumer Demand • Quantity Demanded (Qd) • willing and able to buy at a given price • Demand (D) • the relationship between Qd and price of a good or service holding all else constant.
BBQ Sandwiches individual consumers price total bbq kate michael alison $5.00 1 0 0 1 $4.00 1 1 0 2 $3.00 2 1 0 3 $2.00 2 1 1 4 $1.00 2 2 1 5
$5.00 $4.00 $3.00 $2.00 $1.00 1 2 3 4 5 Demand for BBQ Sandwiches Price ($ per sandwich) Quantity
$5.00 $4.00 $3.00 $2.00 $1.00 1 2 3 4 5 Demand for BBQ Sandwiches Price ($ per sandwich) Quantity
$5.00 $4.00 $3.00 $2.00 $1.00 1 2 3 4 5 Demand for BBQ Sandwiches Price ($ per sandwich) D Quantity
$5.00 $4.00 $3.00 $2.00 $1.00 1 2 3 4 5 Moving Along the Demand Curve Price ($ per sandwich) Qd change in response to price D Quantity
$5.00 $4.00 $3.00 $2.00 $1.00 1 2 3 4 5 Moving Along the Demand Curve Price ($ per sandwich) Qd change in response to price D Quantity
Moving Along the Demand Curve • Consumer Response to Price Change? • substitution effect • income effect
Consumer Demand • Moving Along the Demand Curve • response to a change in price • Shifting the Demand Curve? • response to a change in something else • (other things that alter consumer decision)
$5.00 $4.00 $3.00 $2.00 $1.00 1 2 3 4 5 Shifting the Demand Curve Price ($ per sandwich) shift entire curve in response to something else D0 Quantity
$5.00 $4.00 $3.00 $2.00 $1.00 1 2 3 4 5 Shifting the Demand Curve Price ($ per sandwich) “increase demand” (more Qd at every price) D1 D0 Quantity
$5.00 $4.00 $3.00 $2.00 $1.00 1 2 3 4 5 Shifting the Demand Curve Price ($ per sandwich) “decrease demand” (less Qd at every price) D0 D2 Quantity
Shifting the Demand Curve • Change in Consumer Preferences • tastes, trends and new information • Change in Consumer Income • normal goods and inferior goods • Other • change in price of substitutes or complements • change in number of potential buyers • change in expectations of future prices
BBQ Sandwiches individual producers price total bbq stateline little pigs starnes $5.00 20 18 15 60 $4.00 12 16 14 50 $3.00 8 10 12 40 $2.00 0 4 12 30 $1.00 0 0 0 0
Price ($ per sandwich) 5 producer choice? (decision to sell) 4 3 2 1 0 20 40 60 80 100 Quantity (barbecue sandwiches)
Price ($ per sandwich) Supply 5 producer choice (decision to sell) 4 3 2 1 0 20 40 60 80 100 Quantity (barbecue sandwiches)
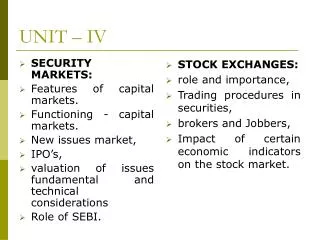
Supply (a quick peek) • Quantity Supplied (Qs) • what producers make available at a given price • Producer Response to Price Change? • opportunity cost & MB of a higher price • Moving Along the Supply Curve • response to a change in price • Shifting the Supply Curve • input costs, technical change, number of sellers
Price ($ per sandwich) Supply 5 producer choice (decision to sell) 4 3 2 1 0 20 40 60 80 100 Quantity (barbecue sandwiches)
Price ($ per sandwich) 5 consumer choice (decision to buy) 4 3 2 1 Demand 0 20 40 60 80 100 Quantity (barbecue sandwiches)
Market for BBQ Sandwiches Price ($ per sandwich) Supply 5 4 buyers & sellers together 3 2 1 Demand 0 20 40 60 80 100 Quantity (barbecue sandwiches)
Shift Which Curve? Increase or Decrease? • market for bbq sandwiches . . . new information that bbq prevents heart disease (2) market for apple juice . . . decline in price for cranberry juice (3) market for fresh baked bread . . . increase in wages of bakery workers (4) market for barbecue sandwiches . . . new smokehouse technology (reduce cost, same quality)
Market for BBQ Sandwiches 6 S Price 5 4 P* 3 2 1 D 0 20 40 60 80 100 Quantity (barbecue sandwiches) Q*
Market Allocation • at equilibrium price Qd equals Qs who buys & who sells? • why do prices move toward equilibrium? if price is too low . . . . if price is too high . . . .
Market for BBQ Sandwiches 6 S Price 5 4 P* 3 2 1 D 0 20 40 60 80 100 Quantity (barbecue sandwiches) Q*
Market Allocation • demand shifts & market responses why would demand shift? how do P & Q change? what leads to movement along S? • scarce resources & unlimited wants prices, incentives, choices (decentralized)
Demand Shift S 6 Price 5 event? medical research reveals health benefits of bbq. 4 3 2 1 D0 0 20 40 60 80 100 120 140 Quantity (barbecue sandwiches)
Demand Increase S 6 Price 5 event? medical research reveals health benefits of bbq. 4 3 2 D1 1 D0 0 20 40 60 80 100 120 140 Quantity (barbecue sandwiches)
A Note on Oil Prices • what may have shifted? which direction? • 2001 to 2004, Spring 2012: prices rising, consumption rising • Aug 2008 to April 2009: prices falling, consumption declining • demand issues • economic growth (US, China & India, World) • global recession (2008-09) • industrialization vs. conservation, preferences • alternative energy sources, price of substitutes
Market Allocation • supply shifts & market responses why would supply shift? how do P & Q change? what leads to movement along D? • scarce resources & unlimited wants prices, incentives, choices (decentralized)
Supply Shift S0 Price 6 5 4 event? costs of hiring bbq cooks increase for all producers. 3 2 1 D 0 20 40 60 80 100 120 140 Quantity (barbecue sandwiches)
Supply Decrease S0 S1 Price 6 5 4 event? costs of hiring bbq cooks increase for all producers. 3 2 1 D 0 20 40 60 80 100 120 140 Quantity (barbecue sandwiches)
A Note on Oil Prices • what may have shifted? which direction? • 1979 to 1981: prices rising, consumption declining • Dec 2004 to Sept 2005: prices rising, consumption declining • supply issues • coordinated decisions (OPEC), “number” of producers • global/regional conflicts, production costs (& uncertainty) • constraints on refinery capacity (Katrina & Rita), opportunity costs
Understanding Price Movements Bananas, Weather in Honduras
Shift Which Curve? Increase or Decrease?What Happens to Price and Quantity? • market for bbq sandwiches . . . (D increase) new information that bbq prevents heart disease (2) market for apple juice . . . (D decrease) decline in price for cranberry juice (3) market for fresh baked bread . . . (S decrease) increase in wages of bakery workers (4) market for barbecue sandwiches . . . (S increase) new smokehouse technology (reduce cost, same quality)
(1) Increase Demand S Price D Quantity
(1) Increase Demand S Price P1 P0 Dbefore Dafter Q0 Q1 Quantity
(4) Increase Supply S Price D Quantity
(4) Increase Supply S (initial) Price S (tech advance) D Quantity
What Markets Do Well • use information relevant information, decentralized sources, conveyed through price, helpful incentive • respond to changing conditions response to price (self), solution to problem (society) • deliver efficiency satisfy most wants from given resources, (the promise of markets under ideal conditions)
Market for Coffee Price S (initial) initial price D initial quantity Quantity
Market for Coffee S (weather event) Price S (initial) new price information, incentives, helpful responses, (efficient reallocation of society’s resources). initial price D Q1 Q0 Quantity Q decline
Efficient Outcomes • what is efficiency? satisfying the most wants from given resources (markets provide gains from voluntary exchange) • consumer surplus what you get is worth more than you pay marginal benefit above price • producer surplus producer gets paid more than they sacrifice price above marginal opportunity cost
Market for Coffee Price S consumer surplus for coffee lovers P1 D Q1 Quantity
Market for Coffee Price S P1 producer surplus for coffee firms D Q1 Quantity