Download
1 / 10
100 likes | 194 Views
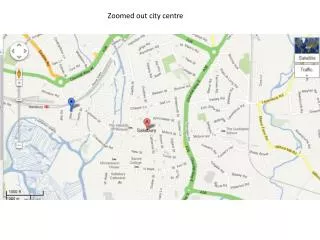
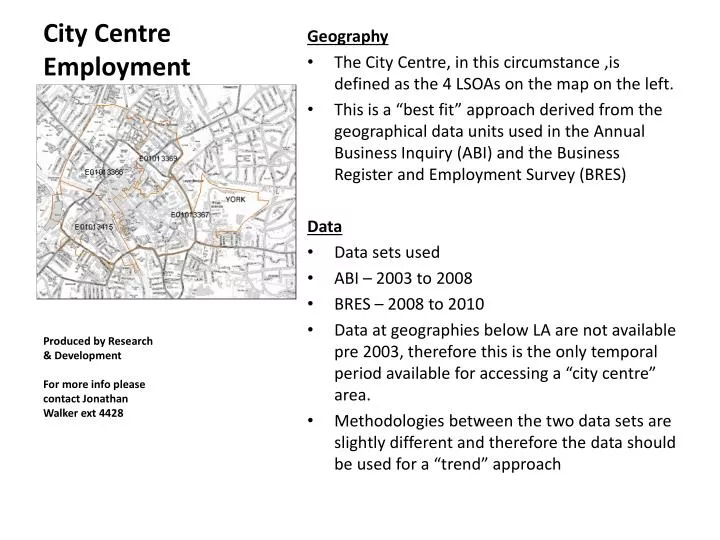
City Centre Employment. Geography The City Centre, in this circumstance ,is defined as the 4 LSOAs on the map on the left. This is a “best fit” approach derived from the geographical data units used in the Annual Business Inquiry (ABI) and the Business Register and Employment Survey (BRES)

E N D
City Centre Employment Geography • The City Centre, in this circumstance ,is defined as the 4 LSOAs on the map on the left. • This is a “best fit” approach derived from the geographical data units used in the Annual Business Inquiry (ABI) and the Business Register and Employment Survey (BRES) Data • Data sets used • ABI – 2003 to 2008 • BRES – 2008 to 2010 • Data at geographies below LA are not available pre 2003, therefore this is the only temporal period available for accessing a “city centre” area. • Methodologies between the two data sets are slightly different and therefore the data should be used for a “trend” approach Produced by Research & Development For more info please contact Jonathan Walker ext 4428
The changing structure of the city centre is apparent over this time period. The proportions of the following sectoralgroups have increased: The proportions of the following sectoral groups have decreased:
City Centre Retail Employees Wholesale and retail trade; repair of motor vehicles, motorcycles and personal and household goods
Experian GOAD Use class data – City Centre (different Geography to data above) • Experian GOAD data is showing a change from A1 “retail” uses towards more “leisure” uses in the city centre
Business Start up Data 2011(all businesses) The highest proportion of business start ups are in the “city centre” wards of Guildhall and Micklegate