Download
1 / 1
10 likes | 82 Views
700. 600. 500. 400. 300. 200. 100. 0. 2. 4. 6. 8. 10. 12. 14. 16. 18. day. Pelagic Ecosystems in a High CO 2 Ocean : the Mesocosm Approach. Pe lagic E cosystem C O 2 E nrichment Study.

E N D
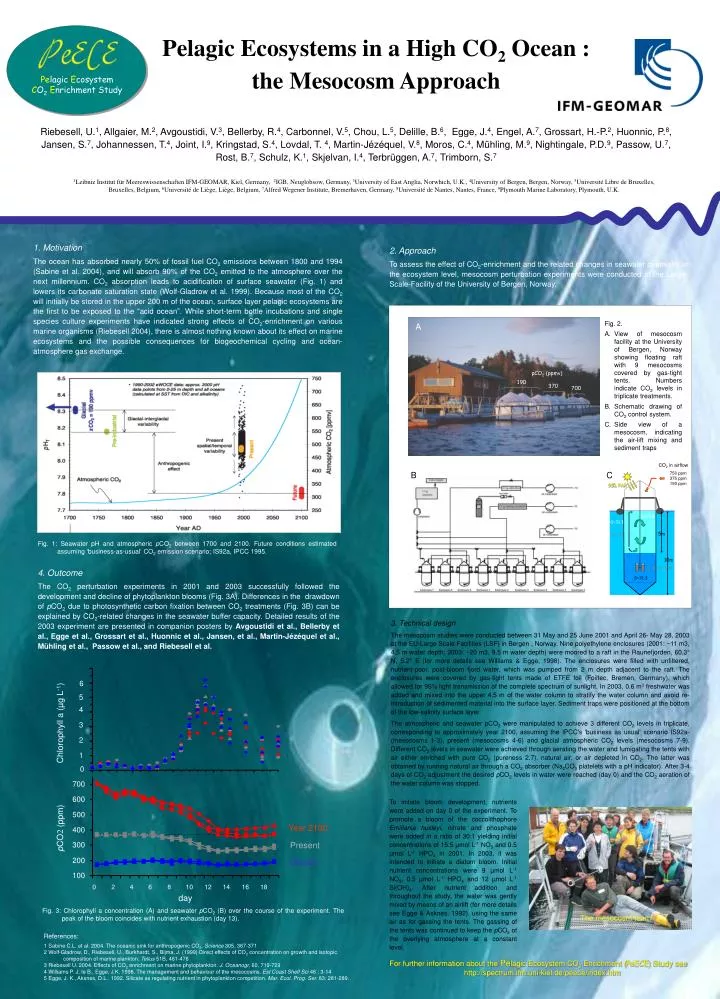
700 600 500 400 300 200 100 0 2 4 6 8 10 12 14 16 18 day Pelagic Ecosystems in a High CO2 Ocean : the Mesocosm Approach Pelagic Ecosystem CO2Enrichment Study Riebesell, U.1, Allgaier, M.2, Avgoustidi, V.3, Bellerby, R.4, Carbonnel, V.5, Chou, L.5, Delille, B.6, Egge, J.4, Engel, A.7, Grossart, H.-P.2, Huonnic, P.8, Jansen, S.7, Johannessen, T.4, Joint, I.9, Kringstad, S.4, Lovdal, T. 4, Martin-Jézéquel, V.8, Moros, C.4, Mühling, M.9, Nightingale, P.D.9,Passow, U.7,Rost, B.7, Schulz, K.1, Skjelvan, I.4, Terbrüggen, A.7, Trimborn, S.7 1Leibniz Institut für Meereswissenschaften IFM-GEOMAR, Kiel, Germany, 2IGB, Neuglobsow, Germany, 3University of East Anglia, Norwhich, U.K., 4University of Bergen, Bergen, Norway, 5Université Libre de Bruxelles, Bruxelles, Belgium, 6Université de Liège, Liège, Belgium, 7Alfred Wegener Institute, Bremerhaven, Germany, 8Université de Nantes, Nantes, France, 9Plymouth Marine Laboratory, Plymouth, U.K. 1. Motivation The ocean has absorbed nearly 50% of fossil fuel CO2 emissions between 1800 and 1994 (Sabine et al. 2004), and will absorb 90% of the CO2 emitted to the atmosphere over the next millennium. CO2 absorption leads to acidification of surface seawater (Fig. 1) and lowers its carbonate saturation state (Wolf-Gladrow et al. 1999). Because most of the CO2 will initially be stored in the upper 200 m of the ocean, surface layer pelagic ecosystems are the first to be exposed to the “acid ocean”. While short-term bottle incubations and single species culture experiments have indicated strong effects of CO2-enrichment on various marine organisms (Riebesell 2004), there is almost nothing known about its effect on marine ecosystems and the possible consequences for biogeochemical cycling and ocean-atmosphere gas exchange. 2. Approach To assess the effect of CO2-enrichment and the related changes in seawater chemistry at the ecosystem level, mesocosm perturbation experiments were conducted at the Large-Scale-Facility of the University of Bergen, Norway. • Fig. 2. • View of mesocosm facility at the University of Bergen, Norway showing floating raft with 9 mesocosms covered by gas-tight tents. Numbers indicate CO2 levels in triplicate treatments. • Schematic drawing of CO2 control system. • Side view of a mesocosm, indicating the air-lift mixing and sediment traps A pCO2 (ppmv) 190 370 700 CO2 in airflow 750 ppm 375 ppm 190 ppm B C 95% PAR S=29.8 S=31.3 5m Air lift Fig. 1: Seawater pH and atmospheric pCO2 between 1700 and 2100. Future conditions estimated assuming ‘business-as-usual‘ CO2 emission scenario; IS92a, IPCC 1995. 10m Sediment Trap 4. Outcome The CO2 perturbation experiments in 2001 and 2003 successfully followed the development and decline of phytoplankton blooms (Fig. 3A). Differences in the drawdown of pCO2 due to photosynthetic carbon fixation between CO2 treatments (Fig. 3B) can be explained by CO2-related changes in the seawater buffer capacity. Detailed results of the 2003 experiment are presented in companion posters by Avgoustidi et al.,Bellerby et al., Egge et al., Grossart et al., Huonnic et al., Jansen, et al., Martin-Jézéquel et al., Mühling et al., Passow et al., and Riebesell et al. S=31.3 3. Technical design The mesocosm studies were conducted between 31 May and 25 June 2001and April 26-May 28, 2003at the EU-Large Scale Facilities (LSF) in Bergen, Norway. Nine polyethylene enclosures (2001: ~11 m3, 4.5 m water depth; 2003: ~20 m3, 9.5 m water depth) were moored to a raft in the Raunefjorden, 60.3° N, 5.2° E (for more details see Williams & Egge, 1998). The enclosures were filled with unfiltered, nutrient-poor, post-bloom fjord water, which was pumped from 2 m depth adjacent to the raft. The enclosures were covered by gas-tight tents made of ETFE foil (Foiltec, Bremen, Germany), which allowed for 95% light transmission of the complete spectrum of sunlight. In 2003, 0.6 m3 freshwater was added and mixed into the upper 4.5 m of the water column to stratify the water column and avoid re-introduction of sedimented material into the surface layer. Sediment traps were positioned at the bottom of the low-salinity surface layer. The atmospheric and seawater pCO2 were manipulated to achieve 3 different CO2 levels in triplicate, corresponding to approximately year 2100, assuming the IPCC's 'business as usual' scenario IS92a- (mesocosms 1-3), present (mesocosms 4-6) and glacial atmospheric CO2 levels (mesocosms 7-9). Different CO2 levels in seawater were achieved through aerating the water and fumigating the tents with air either enriched with pure CO2 (pureness 2.7), natural air, or air depleted in CO2. The latter was obtained by running natural air through a CO2 absorber (Na2CO3 platelets with a pH indicator). After 3-4 days of CO2 adjustment the desired pCO2 levels in water were reached (day 0) and the CO2 aeration of the water column was stopped. 6 5 4 Chlorophyll a (µg L-1) 3 2 1 0 To initiate bloom development, nutrients were added on day 0 of the experiment. To promote a bloom of the coccolithophore Emiliania huxleyi, nitrate and phosphate were added in a ratio of 30:1 yielding initial concentrations of 15.5 µmol L-1 NO3 and 0.5 µmol L-1 HPO4 in 2001. In 2003, it was intended to initiate a diatom bloom. Initial nutrient concentrations were 9 µmol L-1 NO3, 0.5 µmol L-1 HPO4 and 12 µmol L-1 Si(OH)4. After nutrient addition and throughout the study, the water was gently mixed by means of an airlift (for more details see Egge & Asknes, 1992), using the same air as for gassing the tents. The gassing of the tents was continued to keep the pCO2 of the overlying atmosphere at a constant level. Year 2100 pCO2 (ppm) Present Glacial Fig. 3: Chlorophyll a concentration (A) and seawater pCO2 (B) over the course of the experiment. The peak of the bloom coincides with nutrient exhaustion (day 13). The mesocosm team References: 1 Sabine C.L. et al. 2004. The oceanic sink for anthropogenic CO2. Science 305, 367-371 2 Wolf-Gladrow, D., Riebesell, U., Burkhardt, S., Bijma, J. (1999) Direct effects of CO2 concentration on growth and isotopic composition of marine plankton. Tellus 51B, 461-476 3 Riebesell U. 2004. Effects of CO2 enrichment on marine phytoplankton. J. Oceanogr. 60, 719-729 4 Williams P. J. le B., Egge, J.K. 1998. The management and behaviour of the mesocosms. Est Coast Shelf Sci 46 : 3-14 5 Egge, J. K., Aksnes, D.L.. 1992. Silicate as regulating nutrient in phytoplankton competition. Mar. Ecol. Prog. Ser. 83: 281-289. For further information about the Pelagic Ecosystem CO2 Enrichment (PeECE) Study see http://spectrum.ifm.uni-kiel.de/peece/index.htm