Download
1 / 14
160 likes | 351 Views
Measuring the Environmental Benefits of Conservation. The Conservation Effects Assessment Project (CEAP). A National Assessment of the Field-Level Effects of Conservation Practices on Cropland. CEAP—Conservation Effects Assessment Program. Scope of CEAP. RESOURCE CONCERNS Water Quality

E N D
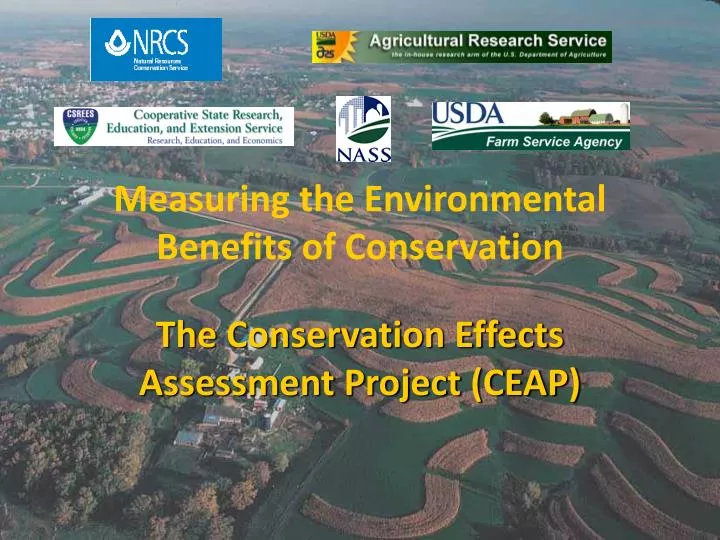
Measuring the Environmental Benefits of Conservation The Conservation Effects Assessment Project (CEAP)
A National Assessment of the Field-Level Effects of Conservation Practices on Cropland CEAP—Conservation Effects Assessment Program
Scope of CEAP RESOURCE CONCERNS Water Quality Soil Quality Water Conservation Air Quality Wildlife Habitat Ecosystem Health Livestock Operations
Schematic for Construction of the National Assessment Onsite (field-level) Effects Field-level modeling APEX Farm survey data at NRI-CEAP sample points Off-Site Water Quality Effects Watershed modeling HUMUS/SWAT
about 800,000 sample points in the current NRI, about 300,000 of which are cropland points 269,000 points representing the major cropping areas
Primary Sample Unit (PSU) Points Statistical Design
Survey Data Crop rotation (5 years) Planting and harvest dates, yields Tillage practices (equipment used) Fertilizer rate, form, timing, and placement Manure rate, source, timing, and placement Crop protection rate, form, timing, and placement Conservation practices applied to field
Cropland National Assessment-- Goals Estimate the benefits of conservation practices currently present on the landscape Estimate the need for conservation practices and the benefits that could be realized under “full treatment” Simulate alternative options for implementing conservation programs on cropland
Modeling Strategy Estimate a CEAP Baseline using farmer survey information at NRI sample points Construct an alternative scenario assuming “no practices” Difference between these two scenarios represents the benefits of the accumulation of conservation practices currently in place.
Point Sources Non-Cultivated Lands APEX Cultivated Fields Channel/Flood Plain Processes SWAT
Western Lake Erie Subregion • 4.8 million acres cropland • 13% Highly Erodible Land • 8% receiving manure • 4.7” / 7.0” runoff / subsurface flow • 0.15 / 0.44 tons of sediment loss wind/water • Gaining soil carbon @ 66 lbs / acre / year
Western Lake Erie Subregion • Nitrogen utilization all sources = 147 lbs /acre • Phosphorus utilization all sources = 21 lbs/ac • Phosphorus Losses = 2.3 lbs / acre • Water erosion = 2.0lbs /acre • Wind erosion = 0.3 lbs • Nitrogen Losses = 38 lbs /acre • Erosion + Runoff = 7 lbs/acre • Subsurface flow = 19 lbs