Download
1 / 1
10 likes | 118 Views
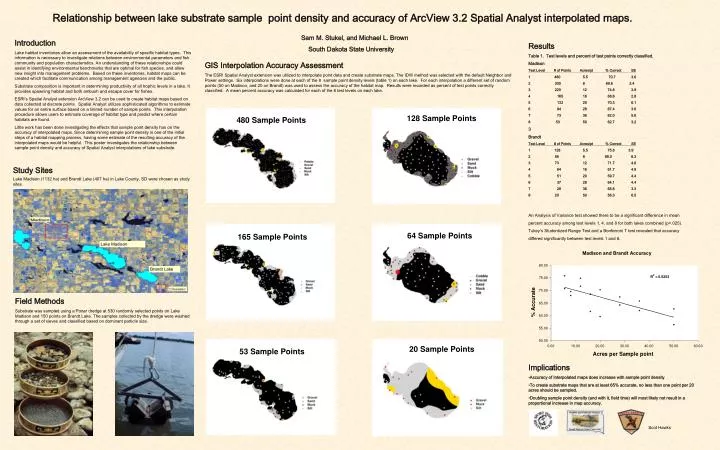
128 Sample Points. 480 Sample Points. Lake Madison. 165 Sample Points. 64 Sample Points. Brandt Lake. 20 Sample Points. 53 Sample Points. Relationship between lake substrate sample point density and accuracy of ArcView 3.2 Spatial Analyst interpolated maps.

E N D
128 Sample Points 480 Sample Points Lake Madison 165 Sample Points 64 Sample Points Brandt Lake 20 Sample Points 53 Sample Points Relationship between lake substrate sample point density and accuracy of ArcView 3.2 Spatial Analyst interpolated maps. Sam M. Stukel, and Michael L. Brown South Dakota State University Introduction Lake habitat inventories allow an assessment of the availability of specific habitat types. This information is necessary to investigate relations between environmental parameters and fish community and population characteristics. An understanding of these relationships could assist in identifying environmental benchmarks that are optimal for fish species, and allow new insight into management problems. Based on these inventories, habitat maps can be created which facilitate communication among management agencies and the public. Substrate composition is important in determining productivity of all trophic levels in a lake. It provides spawning habitat and both ambush and escape cover for fishes. ESRI’s Spatial Analyst extension ArcView 3.2 can be used to create habitat maps based on data collected at discrete points. Spatial Analyst utilizes sophisticated algorithms to estimate values for an entire surface based on a limited number of sample points. This interpolation procedure allows users to estimate coverage of habitat type and predict where certain habitats are found. Little work has been done investigating the effects that sample point density has on the accuracy of interpolated maps. Since determining sample point density is one of the initial steps of a habitat mapping process, having some estimate of the resulting accuracy of the interpolated maps would be helpful. This poster investigates the relationship between sample point density and accuracy of Spatial Analyst interpolations of lake substrate. • Results • Table 1. Test levels and percent of test points correctly classified. • Madison • Test Level # of Points Acres/pt % Correct SE • 1 480 5.5 70.7 3.6 • 330 8 69.6 2.4 • 220 12 74.8 3.9 • 4 165 16 68.6 2.8 • 5 132 20 70.3 6.1 • 6 94 28 67.4 3.6 • 7 73 36 62.0 5.6 • 53 50 62.7 3.2 • Brandt • Test Level # of Points Acres/pt % Correct SE • 1 128 5.5 75.8 3.9 • 85 8 68.0 6.3 • 73 12 71.7 4.6 • 4 64 16 61.7 4.9 • 5 51 20 59.7 4.4 • 6 37 28 64.1 4.4 • 7 28 36 65.8 3.3 • 20 50 56.3 6.5 • An Analysis of Variance test showed there to be a significant difference in mean • percent accuracy among test levels 1, 4, and 8 for both lakes combined (p=.025). • Tukey’s Studentized Range Test and a Bonferroni T test revealed that accuracy • differed significantly between test levels 1 and 8. GIS Interpolation Accuracy Assessment The ESRI Spatial Analyst extension was utilized to interpolate point data and create substrate maps. The IDW method was selected with the default Neighbor and Power settings. Six interpolations were done at each of the 8 sample point density levels (table 1) on each lake. For each interpolation a different set of random points (50 on Madison, and 20 on Brandt) was used to assess the accuracy of the habitat map. Results were recorded as percent of test points correctly classified. A mean percent accuracy was calculated for each of the 8 test levels on each lake. Study Sites Lake Madison (1132 ha) and Brandt Lake (407 ha) in Lake County, SD were chosen as study sites. Field Methods Substrate was sampled using a Ponar dredge at 530 randomly selected points on Lake Madison and 150 points on Brandt Lake. The samples collected by the dredge were washed through a set of sieves and classified based on dominant particle size. • Implications • Accuracy of Interpolated maps does increase with sample point density • To create substrate maps that are at least 65% accurate, no less than one point per 20 acres should be sampled. • Doubling sample point density (and with it, field time) will most likely not result in a proportional increase in map accuracy. Scot Hawks