Download
1 / 28
280 likes | 422 Views
SeeSys: Space-Filling Software Visualization Marla J. Baker Stephen G. Eick AT&T Bell Labs. Description of the paper. A concrete application of TreeMaps Influenced by Dynamic Queries as well Provides a high-level visualization of a large-scale software engineering project

E N D
SeeSys: Space-Filling Software VisualizationMarla J. BakerStephen G. EickAT&T Bell Labs
Description of the paper • A concrete application of TreeMaps • Influenced by Dynamic Queries as well • Provides a high-level visualization of a large-scale software engineering project • A fast way of getting an overview from a CVS repository? • In other words: CVS for management • This is a “real-world” application!
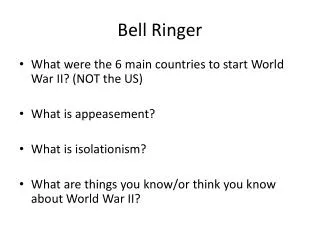
What questions do we want to answer visually? • Which subsystems are the largest? Where is new development activity? • Where are the large directories? How are the directories changing? • What proportion of work on a subsystem relates to fixing bugs as opposed to adding new functionality? • What components are candidates for code restructuring, based on their histories of required bug fixes? • How are the subsystems changing between releases?
What assumptions must we make about the information to be visualized? • The Data must be: • Quantitative Why? So we can easily compare different elements and display them with graphs. • Additive. Why? So we can break a whole up into parts, and know that the sum of these parts will reproduce the whole. • TreeMaps seem to require these two notions.
Any hidden assumptions? Yes! We’re also assuming that these types of metrics are easily kept by every programmer on the project, and feasibly attainable to SeeSys. Basically, we assume that something like CVS is running underneath SeeSys. Is this a valid assumption? Of course! But I wanted to make this explicit.
What can we measure about our target system? • Non-comment source lines (NCSL) • Software complexity metrics • How do we get these? • Number and scope of modifications • Number of programmers making modifications • Number and type of bugs (a subcategory of modifications)
1) Subsystem Information • Question: Which subsystems are largest? • Check the area of a bounding box • Check the color (redundant coloring) • Question: Where is new development taking place? • Check the gray-fill area of a bounding box • It is perpendicular to the division of the bounding boxes
2) Directory Information • Question: Where are the large directories? • Find the thickest slices of a subsystem’s bounding box • They are parallel to the division of the subsystems • Larger slices are brighter in hue • Newly added code is grey filled
3) Error-Prone Code • Question: Which subsystems and directories have the most bugs? • No more redundant coloring (why?) • Area of each subsystem represents new NCLS • Area of grey-fill is NCSL dedicated to bug fixes • Blue spikes represent “directory bug fixing NCSL detail”
4) Recurring Problems • Question: What subsystems would make good candidates for code restructuring? • Area of each subsystem represents number of bugs • Grey-fill area represents fix-on-fix bugs • Blue spikes again represent directory detail • Why can’t I zoom in here! Ahh!
5) System Evolution • Question: How have subsystems changed between versions? • Area of rectangle represents largest size ever • Colored fill area represents size under current version • Can animate from one version to subsequent versions to get a picture over time • Could this be improved?
Favorite Sentence “When applied to production-sized systems, routines for producing flow-charts, function call-graphs, and structure diagrams often break because the display is too complicated. Or they produce displays that contain too much information and are illegible.” I translate this to read: Unlike the other tools I’ve cited, which are all nice little toys if you’re locked away in your ivory tower, this is not a toy application! This is a real-world application!
Contributions • Concrete, useful, large-scale, real-world application of TreeMaps • Proof of concept that TreeMaps can handle extremely large datasets in a sensible way. • Showcases effective use of redundant coloring • Highlights hierarchical zooming– from subsystem, to directory, to file– between versions
Contributions cont’d Still, much better than this: Index: BundleDownloader.java =================================================================== RCS file: /fs/savoir/pugh/p/cvs/java/daveho/cl/BundleDownloader.java,v retrieving revision 1.11 diff -u -r1.11 BundleDownloader.java --- BundleDownloader.java 2000/08/29 15:31:49 1.11 +++ BundleDownloader.java 2001/02/07 20:15:53 @@ -56,10 +56,11 @@ if ( tag == BundleProtocol.NOTFOUND ) { String name = m_input.readUTF(); callback.notFound( name ); + continue; } if ( tag != BundleProtocol.BUNDLE ) - throw new IllegalArgumentException("Invalid tag byte"); + throw new IllegalArgumentException("Invalid tag byte: " + tag); int length = m_input.readInt(); if ( debug ) {
Notes on the references • Cites the TreeMaps paper (Johnson and Schneiderman, 1991) • Cites work on visualizing line-oriented data, such as an idividual source file. This looks cool! But it’s not relevant. • Cites lots of other papers, too… But I think the TreeMaps paper is the major influence on this work.
Critique - weaknesses • I really want zoomed-in pictures of directories with error-prone code and recurring problems! • I’m not sure the techniques used to display error-prone code and recurring problems were all that great anyway… • The screenshots, even in the original paper, are terrible. • No measurements! I want to see “4 out of 5 middle managers prefer SeeSys to the leading brand.”
Critique – strengths • Short, simple, elegant paper • Attacks a real problem • Doesn’t try to do too much– SeeSys provides high-level visualizations of large, complex software systems. Nothing more.
What has happened to this topic?My web search uncovered that: • Google search reveals: SeeSys is someone’s domain name, and it’s an obscure command in MatLab. • This paper has been referenced 4 times, though 3 were by the same paper which showed up in a couple of places. • I found that a couple software engineering classes study this tool. • I was not able to uncover any commercial organizations that use this particular tool, though I’m not sure if that information is public anyway.
Conclusions • Realistically, what else was left to do? • SeeSys provides useful, general, effective high-level visualizations of any quantitative, additive measurements. • Further useful visualizations would likely be too specific to a given system for this generalized framework • Or would need to be done per line of source code. This is a very different type of visualization problem for which TreeMaps are probably not the best medium. • More sophisticated Q&A measurements are more difficult to obtain– at some point, software engineering becomes an art
My main question: Has this been written in Java? Does GNU have a free version? Can I build this type of TreeMap interface on top of a CVS distribution, like jCVS?